Data Model
The goal of this document is to explain the Solar Forecast Arbiter data model. To keep the framework architecture simple and secure, the API closely follows this data model. Therefore, it is worthwhile for API users to understand the data model. Please see api.forecastarbiter.com for the technical API documentation. The Dashboard should be clear enough that users of it do not need a complete understanding of the data model. The Dashboard contains additional features and abstractions to expedite common use cases. See here for a walkthrough of the Dashboard user interface.
Data ownership, access, and control issues are discussed in Data Policies and Dashboard Administration.
To introduce the data model, consider a framework user who will upload observed data for a new site. The framework user performs the following steps in order:
-
Define a Site by name, location, and timezone, and additional parameters for a Site representing a power plant (e.g. AC capacity, DC capacity).
-
For each Observation:
a. Define the Observation: name, variable (e.g., GHI), interval value type (e.g. instantaneous or average), interval label (N/A, beginning, ending), uncertainty.
b. Upload a time series with each element in the series being a triplet of values: Time, Value, Quality Flag.
In this model, each of several Observations (e.g., GHI, air temperature, wind speed) is uploaded as a separate time series. Because each Observation is associated with a predefined set of metadata, users do not supply metadata in the upload of time series data. Separate uploads for each Observation allows the API to tightly mimic the internal data model, simplifies the data templates, and supports flexible analyses. The Dashboard may contain features to allow users to upload a single csv file with multiple observations.
A framework user uploads a Forecast using the same process as for uploading Observations, except that a Forecast is described by a different set of attributes described later. Each Variable in the forecast (e.g., GHI, air temperature, wind speed) is uploaded as a separate time series comprising Time, Value pairs.
Metadata
This section outlines the primary metadata containers in the Solar Forecast Arbiter: Sites, Observations and Forecasts, and Aggregates. All time series data is linked to an observation or a forecast, which is linked to a site or an aggregate. The figure below outlines the relationships among sites, forecasts and observations, and their associated time series data.
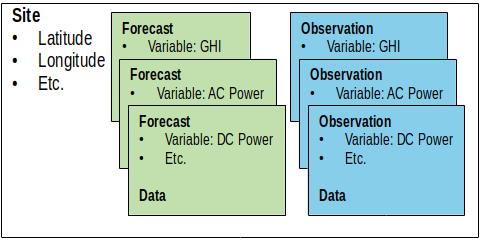
A Site describes a physical location that will have Observations and
Forecasts associated with it. For example, a solar power plant is
entered into Solar Forecast Arbiter as a Site which has many
Observations and Forecasts associated with it (e.g. temperature, GHI, AC
power). In turn, Observations and Forecasts rely on the associated Site
for location information.
An Observation or Forecast contain time series data and specify the data’s associated variable, units, and Site. Forecasts and Observations require specification of the variable being described in the provided data so that they can be properly paired for analysis (see Variables and Units). Forecasts and Observations each have additional required parameters described below.
An Aggregate is an aggregation of many Observations. The Sites associated with each Observation identify the geographic locations a forecast provider may use to create a single aggregated Forecast. The framework may generate an aggregate Observation from the listed Observations.
An Organization groups Sites, Observations, Forecasts, and Users. Organizations provide a logical partition on which to sort objects and create access control rules. Organizations are not otherwise essential to the data model and are not described in depth here.
Creation of new objects requires valid metadata for all required parameters. Most users will use the Solar Forecast Arbiter dashboard to create new objects. The API also supports creation via uploading a valid JSON definition of the object. Metadata for sites, forecasts, and observations is returned as JSON in the Solar Forecast Arbiter API.
Site
Each Site has a number of required parameters that identify the Site. They are:
- Name - name for the Site, e.g. Desert Rock
- Latitude - latitude of the Site in decimal degrees north of the equator, e.g. 36.62373
- Longitude - longitude of the Site in decimal degrees east of the prime meridian, e.g. -116.01947
- Elevation - Elevation of the Site in meters above sea level, e.g. 1007
- Timezone - IANA timezone of the Site, e.g. Etc/GMT+8
Sites that are solar power plants require additional parameters that enable power forecasts. These parameters are listed under the “modeling parameters” key as follows:
- Modeling parameters:
- AC capacity - nameplate AC capacity rating in megawatts
- DC capacity - nameplate DC capacity rating in megawatts
- Temperature Coefficient - The temperature coefficient of DC power in units of % of DC capacity per degree C. Typically -0.2 to -0.5 %/C.
- Tracking type - type of tracking system, i.e. fixed, single axis, two axis
- DC loss factor - applied to DC current. Default 0%.
- AC loss factor - applied to inverter power output. Default 0%.
- For fixed tilt systems:
- Surface tilt - tilt from horizontal of a fixed tilt system, degrees
- Surface azimuth - azimuth angle of a fixed tilt system, degrees
- For single-axis tracked systems:
- Axis tilt - tilt from horizontal of the tracker axis, degrees
- Axis azimuth - azimuth angle of the tracker axis, degrees
- Ground coverage ratio - ratio of total width of modules on a tracker to the distance between tracker axes. For example, for trackers each with two modules of 1m width each, and a spacing between tracker axes of 7m, the ground coverage ratio is 0.286(=2/7).
- Backtrack - True/False indicator of if a tracking system uses backtracking
- Maximum rotation angle - maximum rotation from horizontal of a single axis tracker, degrees
Other parameters may be included in under an “extra parameters” key. The extra parameters may be used by forecasters when implementing other PV models. The framework does not provide a standard set of extra parameters or require a particular format – these are up to the site owner.
Observations
An Observation must be associated with a Site. A Site object must be created before an Observation can be associated with it.
Creation of Observations requires the following parameters:
- Name - name of the Observation
- Variable - variable name, e.g. power, GHI. Each allowed variable has an associated pre-defined unit.
- Interval value type - The type of data in each interval of the observation. Typically interval mean or instantaneous, but additional types may be defined for events.
- Interval length - The length of time between consecutive data points, e.g. 5 minutes, 1 hour.
- Interval label - Indicates if a time labels the beginning or the ending of an interval average, or indicates an instantaneous value, e.g. beginning, ending, instant
- Site - the site that this Observation was generated for.
- Uncertainty - a measure of the uncertainty of the observation values. The format will be determined later.
An optional text description field can record information such as instrument type. Additional parameters may be specified under the “extra parameters” key.
Each Observation has data associated with it. The format of this data is found in the Data Formats section below.
Forecasts
Each Forecast must be associated with a Site. A Site object must be created before a Forecast can be associated with it.
Creation of Forecasts requires the following parameters (see Definitions for more detailed explanation of forecast parameters):
- Name - name of the Forecast
- Issue time of day - The time of day that a forecast run is issued, e.g. 00:30. For forecast runs issued multiple times within one day (e.g. hourly), this specifies the first issue time of day. Additional issue times are uniquely determined by the first issue time and the run length & issue frequency attribute.
- Lead time to start - The difference between the issue time and the start of the first forecast interval, e.g. 1 hour.
- Interval length - The length of time between consecutive data points, e.g. 5 minutes, 1 hour.
- Run length / issue frequency - The total length of a single issued forecast run, e.g. 1 hour. To enforce a continuous, non-overlapping sequence, this is equal to the forecast run issue frequency.
- Interval label - Indicates if a time labels the beginning or the ending of an interval average, or indicates an instantaneous value, e.g. beginning, ending, instant
- Interval value type - The type of the data in each interval of the forecast, e.g. mean, maximum, median.
- Variable - The variable in the forecast, e.g. power, GHI, DNI. Each variable is associated with a standard unit.
- Site - The predefined site that the forecast is for, e.g. Power Plant X or Aggregate Y.
Additional parameters, such as model configuration parameters, may be specified under the “extra parameters” key.
Each Forecast has data associated with it. The format of this data is found in the Data Formats section below.
Probabilistic forecasts
The Solar Forecast Arbiter supports the specification of probabilistic forecasts in terms of a cumulative distribution function (CDF). The metadata for a probabilistic forecast is the same as for a forecast with the addition of two attributes (see Definitions for more detailed explanation of forecast parameters):
- Axis - The axis on which the constant values of the CDF is specified. The axis can be either x (constant variable values) or y (constant percentiles). The axis is fixed and the same for all forecasts in the probabilistic forecast.
- Constant values - The variable values or percentiles for the set of forecasts in the probabilistic forecast.
Aggregates
Each Aggregate is associated with one or more Observations. The Solar Forecast Arbiter calculates aggregated observation data from these Observations. The aggregated observation data conforms to the time parameters of the aggregate’s metadata. Aggregate forecasts are directly associated with an Aggregate. Forecast providers are required to submit a forecast of the aggregated quantity.
Aggregates have the following required parameters:
- Name - Name of the Aggregate
- Description - A description of the makeup of the Aggregate, e.g. all utility scale solar in ISO region
- Variable - variable name, e.g. power, GHI. Each allowed variable has an associated pre-defined unit.
- Aggregate type - The type of data represented by the aggregate. One of sum, mean, median, max, or min.
- Interval length - The length of time between consecutive data points, e.g. 5 minutes, 1 hour. The aggregate interval length must be greater than or equal to the interval length of the observations that go into it.
- Interval label - Indicates if a time labels the beginning or the ending of an interval average. One of beginning or ending.
- Timezone - IANA timezone of the site, e.g. Etc/GMT+8
Additional parameters may be specified under the “extra parameters” key.
After the Aggregate is created, Observations may be associated with it. Observations are included in an aggregate between an Effective From and an Effective Until date defined by the user. Observations are expected to contain all values in their effective range. Any values missing from an observation during computation will cause a failure. To avoid this failure, users should submit NaNs where data is missing for their observations.
Variables and Units
Solar Forecast Arbiter accepts a standard set of variables and units. Data not in the correct units must be converted before it is uploaded. The forecast/observation variables and units that are permitted are as follows:
- Surface temperature - degrees Celsius
- Surface wind speed - meters per second
- Global horizontal irradiance - Watts per meter squared
- Direct normal irradiance - Watts per meter squared
- Diffuse horizontal irradiance - Watts per meter squared
- Plane of array irradiance - Watts per meter squared
- Relative humidity - % from 0.0 to 100.0
- AC power - megawatts
- DC power - megawatts
- Cumulative distribution function (CDF) - Percentiles from 0.0 to 100.0
- Availability - % from 0.0 to 100.0
- Curtailment - megawatts
Please see the Glossary for variable definitions.
Timestamp and timezone formatting is addressed below.
Data Formats
In this section data is defined as both observation and forecast data. The data contain a time series of data points. Each data point has fields determined by the data’s type listed below:
Observations
- Timestamp - A timestamp in ISO-8601 format including a timezone.
e.g.
2018-12-05T23:01:45-07:00or20181206T060145Z. - Value - Values for the variable in units defined above.
- Quality Flag - A flag indicating if the value is questionable. Uploads may contain values 0 (ok) or 1 (questionable). Downloads may contain additional flags determined by the data qualification toolkit.
The observation data must conform the the interval length specified by
the associated metadata. The API will reject uploads that do not
conform. This may require users to resample their data and insert
NaN or NULL as placeholder values for missing data.
Forecasts
Single-valued forecasts (e.g. mean or 50th percentile) comprise a series of Timestamp, Value pairs in the following format:
- Timestamp - A timestamp in ISO-8601 format including a timezone.
e.g.
2018-12-05T23:01:45-07:00or20181206T060145Z. - Value - Values for the variable in units defined above.
Probabilistic forecasts
To upload a complete probabilistic forecast, users upload one forecast for each of the probalistic forecast’s constant values. The format of each upload is the same, but the upload destination specified by the Solar Forecast Arbiter is different.
Downloads
Data is available for download from the Solar Forecast Arbiter API and dashboard as either CSV or JSON files. Both formats contain the name and id of the forecast/observation requested. In the CSV format, this information will be included in the header. In the JSON format, these parameters will be keys in the JSON object with the data listed under “values”.
CSV
# name: Power Plant 1 Power
# id: testid
timestamp,value,quality_flag
2018-11-22T12:00:00Z,10.23,0
2018-11-22T12:05:00Z,10.67,0
JSON
{
  "name": "Power Plant 1 Power",
  "id": "testid",
  "_links": {
    "metadata": "link to additional metadata"
  },
  "values": [
    {
      "timestamp": "2018-11-22T12:00:00Z",
      "value": 10.23,
      "quality_flag": 0
    },
    {
      "timestamp": "2018-11-22T12:05:00Z",
      "value": 10.67,
      "quality_flag": 0
    }
  ]
}
Uploads
Data may be uploaded to the Solar Forecast Arbiter either through the
API or the dashboard in either CSV or JSON format. Valid files must have
timestamps in ISO-8601 format
with time zone. They must also include the value of the data, and a
quality flag of either 0 or 1.
Each file may only contain data for one observation or forecast variable. Multiple observation or forecast variables require multiple file uploads to their respective dashboard pages or API end points.
Observation data uploads will be rejected if any time interval does not match
the associated metadata interval length parameter. Missing data must be
specified with an empty field, NaN, or NULL.
CSV
The CSV file may have comment lines at the top of the file beginning
with one of # ; //. Comment lines are ignored - no metadata is parsed
from them. CSV columns must be delimited by "," and rows must be
delimited by "\n". The CSV must contain a header line of
"timestamp,value,quality_flag" followed by the data rows.
The following block is an example of a valid CSV upload.
# optional header, ignored by Solar Forecast Arbiter
timestamp,value,quality_flag
2019-03-01T12:00:00Z,5,0
2019-03-01T12:05:00Z,,1
2019-03-01T12:10:00Z,5,0
2019-03-01T12:15:00Z,NaN,1
2019-03-01T12:20:00Z,NULL,1
JSON
The JSON file must have a “values” list that contains a data object of “values”, “timestamp”, and “quality_flag”.
{
  "id": "testid", # optional, for uploader’s record
  "values": [
    {
      "timestamp": "2018-11-22T12:01:48Z",
      "value": 10.23,
      "quality_flag": 0
    },
    {
      "timestamp": "2018-11-22T12:07:38Z",
      "value": 10.67,
      "quality_flag": 0
    }
  ]
}