Working with Data
This section describes how to create, upload, and download data using the Solar Forecast Arbiter Dashboard.
The Solar Forecast Arbiter organizes metadata into Sites, Observations, and Forecasts. All time series data is linked to an observation or a forecast, which is linked to a site or an aggregate. All units are fixed in the Solar Forecast Arbiter, e.g. all power data and forecasts should be specified and uploaded in MW. Please see the data model documentation for more details on how the Solar Forecast Arbiter organizes metadata and time series data.
Readers may also be interested in the HTTP API or Python API documentation for instructions on how to perform data operations programmatically.
Notes on Data Access When Creating Metadata
When a user creates new metadata, the user’s organization administrators will control access to the metadata and any associated values. Because metadata is controlled by the organization of the user that created it, granting permission to create metadata to users outside your organization would allow them to create new metadata within their own organization and is not allowed. See Administration and Data Sharing for more information about sharing data in the Solar Forecast Arbiter.
Create New Site
-
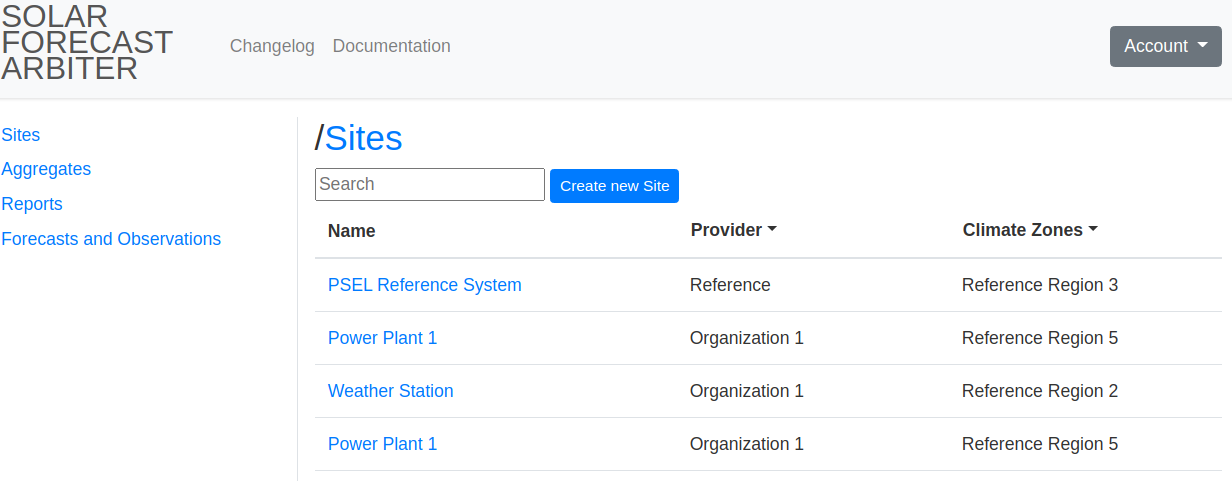
Navigate to sites listing page using Sites link in the left sidebar. At the top of the Site listing click Create new Site.
-
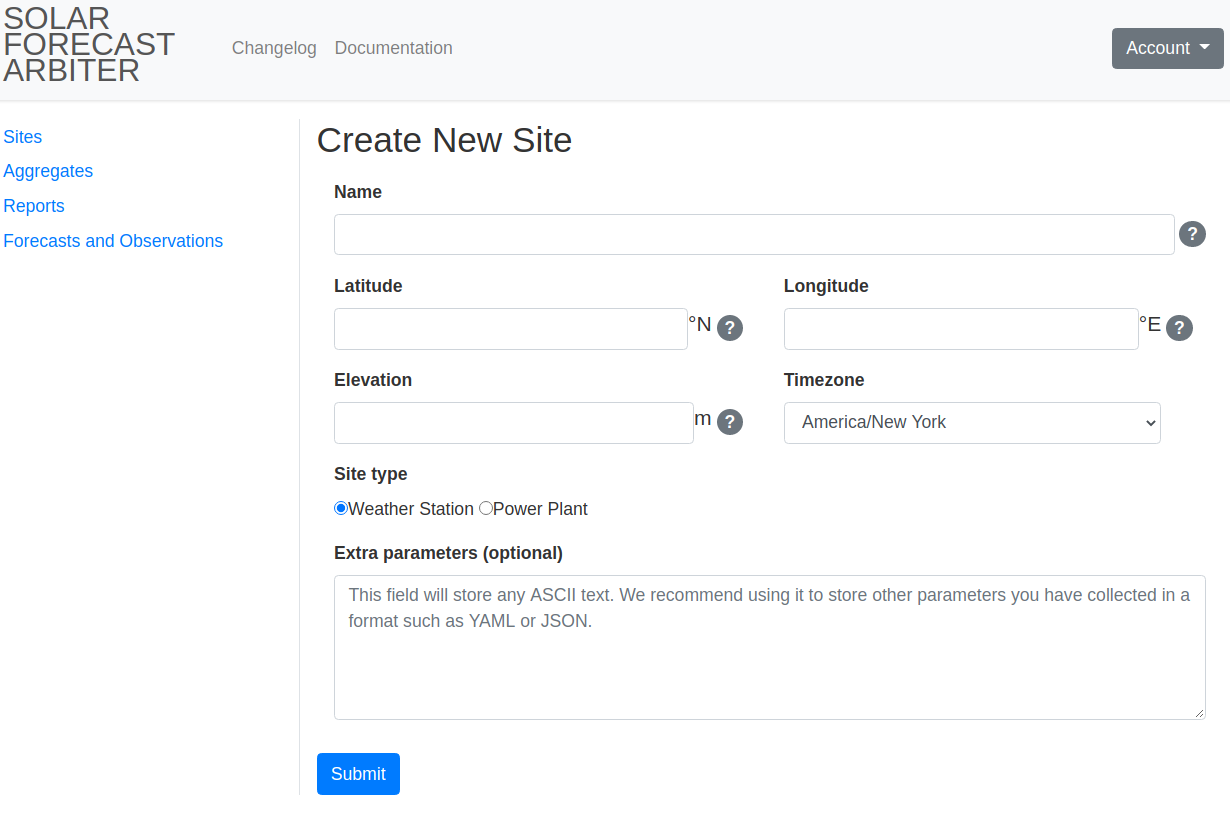
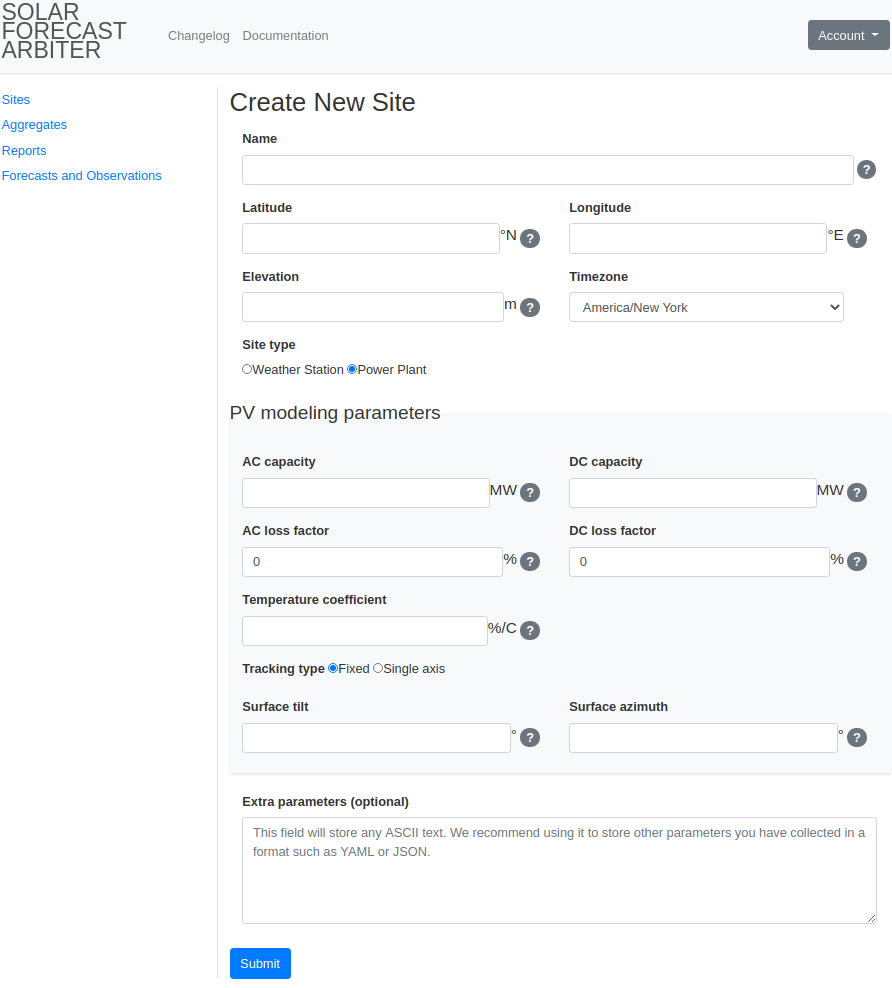
Enter the metadata for your Site. Selecting a site type of Power Plant will prompt you for additional fields.
-
Weather station site creation form
-
Power plant site creation form
-
-
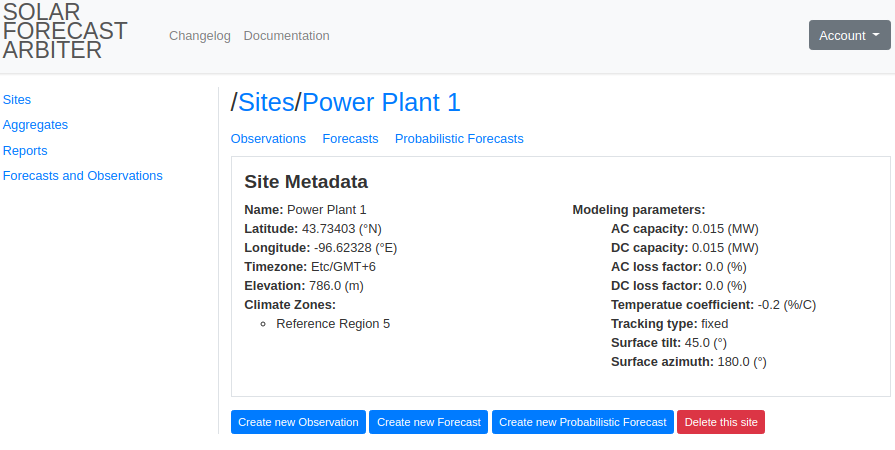
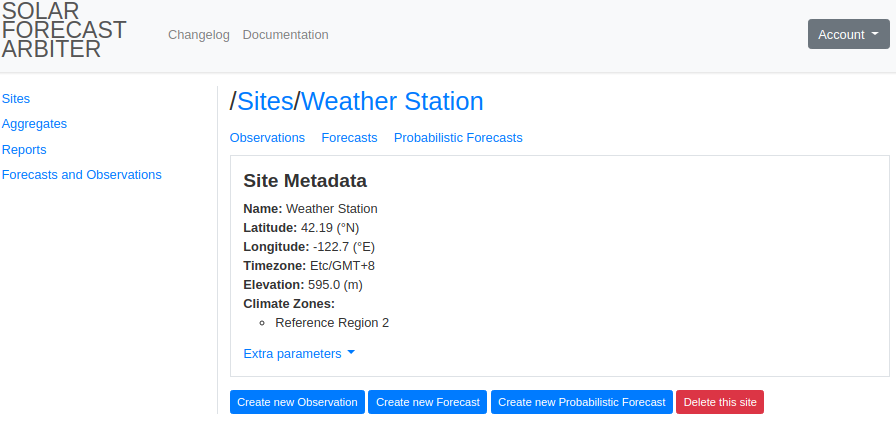
After submission, you will be redirected to a Site page which displays the new Site’s metadata and allows you to create associated Observations and Forecasts (see Create New Observation or Forecast).
Power Plant Site Page
Create New Aggregate
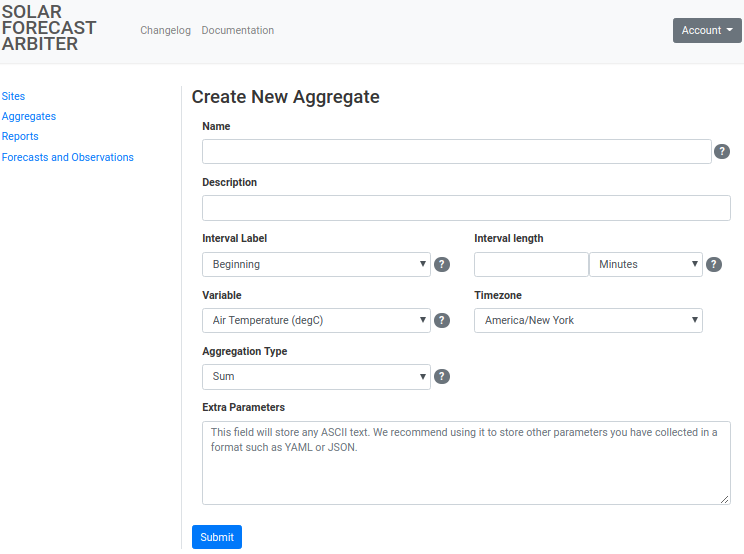
Aggregates are created by first defining metadata for the aggregate, then associating existing observations with it. The aggregate metadata determines how aggregation will be performed and the characteristics of the resulting timeseries data.
Aggregate values will only contain data from constituent observations between their Effective From and Effective Until dates.
Aggregated values inherit the quality flags of the underlying observation values. That is, an aggregate value will have a quality flag if any of the underlying observation values contained that quality flag. See Data Validation for details on quality flags.
-
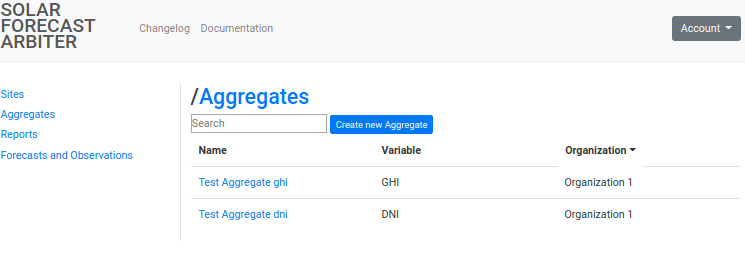
Navigate to the aggregates listing page using the Aggregates link in the left sidebar. At the top of the listing, click Create new Aggregate.
-
Enter the metadata for your Aggregate. Observations added to the aggregate must have the same variable as the aggregate and an interval length less than or equal to that of the aggregate.
-
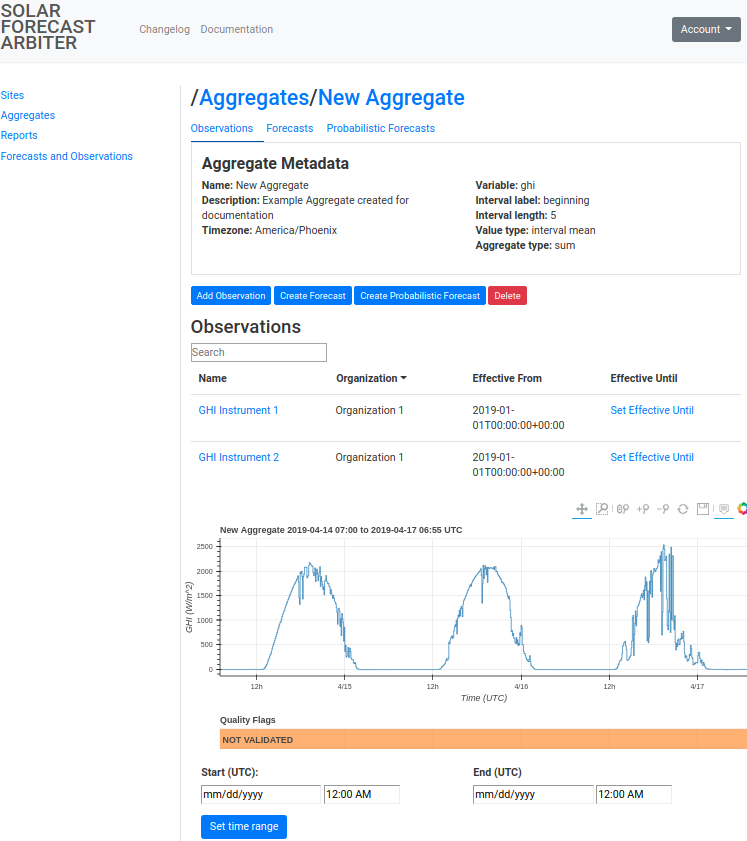
After submission, you will be redirected to an Aggregate page which displays the observations that make up the aggregate (see Add Observations to an Aggregate).
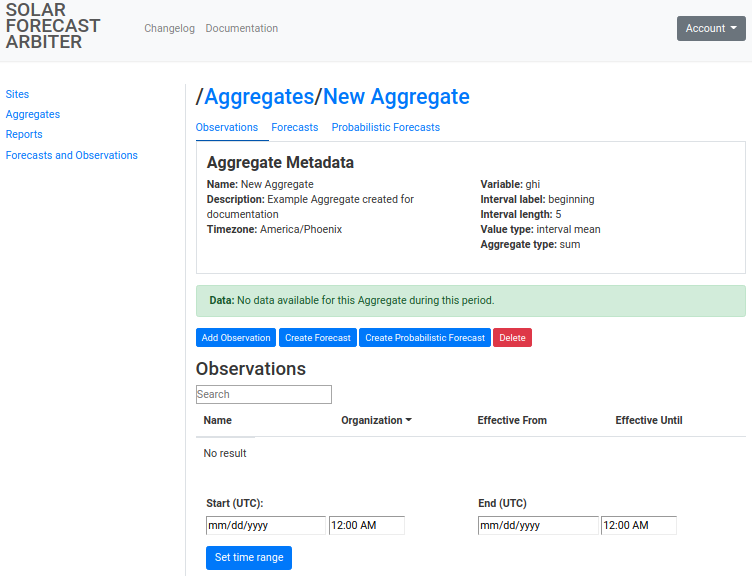
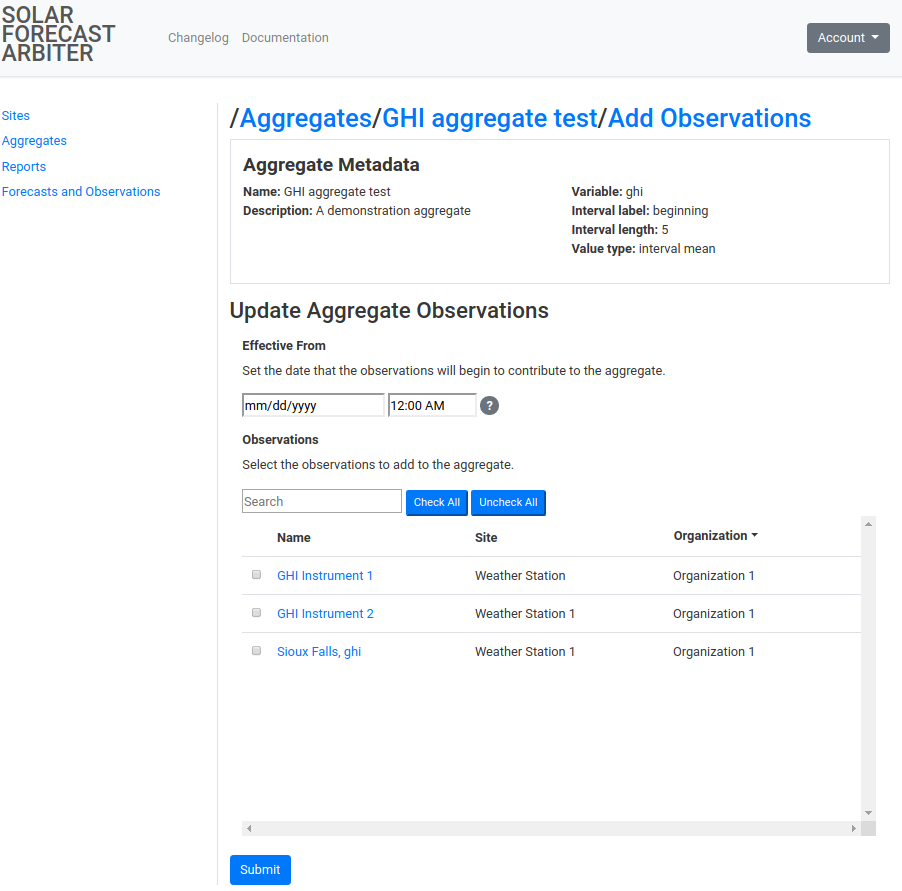
Add Observations to an Aggregate
Observations are included in an aggregate between an Effective From and an Effective Until date defined by the user. Note that observations are expected to contain all values in their effective range. Any missing or NaN values in an included observation will result in a NaN value for the aggregate.
Observations may be added to an Aggregate by following the steps below. Observations must be defined before they can be added to an aggregate (see Create New Observation).
-
Navigate to the Aggregate listing page using the Aggregates link in the left sidebar. Select the Aggregate to add observations to. Click the Add Observation button.
-
Enter an Effective From date. This will determine the start of the period for which the observations should be considered part of the aggregate. Check the boxes for each observation to be included in the aggregate. Note that to add observations for different time periods, you will need to repeat this process with a different Effective From date.
Examples
We would like to create an aggregate from three observations. Observations 1 and 2 have data starting on 2020-01-01T00:00Z. Observation 3 has data starting on 2020-03-01T00:00Z. There are two ways in which we can create this aggregate.
-
Recommended approach: Add observations with different effective from parameters. First we add observations 1 and 2 with an effective from of 2020-01-01T00:00Z. Then we add observation 3 with an effective from of 2020-03-01T00:00Z. With this configuration, the computed aggregate from 2020-01-01T00:00Z to 2020-03-01T00:00Z will contain observations 1 and 2, and the computed aggregate after 2020-03-01T00:00Z will contain observations 1, 2, and 3.
-
Alternative approach: Add all observations with the same effective from, accept NaN values for period with missing data. Using the process above, we add observations 1, 2, and 3 with an effective from of 2020-01-01T00:00Z. The Solar Forecast Arbiter cannot safely assume a value for the missing data, so it will compute the aggregate as NaN from 2020-01-01T00:00Z to 2020-03-01T00:00Z. The computed aggregate after 2020-03-01T00:00Z will contain observation 1, 2, and 3, as expected. If the aggregate represents a sum of power, we may choose to upload 0 values for observation 3 for the missing time period. This choice should be communicated to other users of the data.
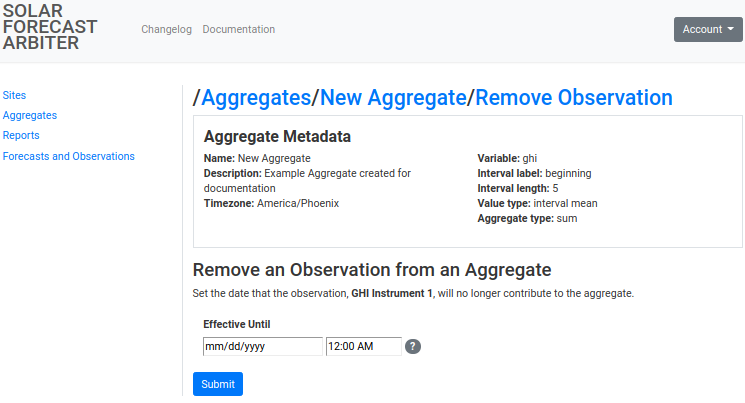
End an Observation’s Contribution to an Aggregate
An observation’s Effective Until date dictates when the observation will stop contributing to an aggregate.
-
Navigate to the Aggregate listing page using the Aggregates link in the left sidebar. Select the Aggregate to update.
-
On the aggregate page, locate the observation to remove in the observations table. Click on the Set Effective Until link for the observation.
-
Enter the Effective Until date for the observation. This will determine the end of the period for which the observations should be considered part of the aggregate. After setting effective until, an observation may be added to the aggregate again for a different or overlapping period of time.
Examples
We have an aggregate with two observations 1 and 2. Both observations have an effective from of 2020-01-01T00:00Z. Below are a few different situations in which we would set the effective until.
-
Data for observation 2 is only available until 2020-06-01T00:00Z. This causes the computed aggregate to return missing values after 2020-06-01T00:00Z. Using the process described above, we set the effective until to 2020-06-01T00:00Z. In this configuration the computed aggregate from 2020-01-01T00:00Z contains observations 1 and 2, and the computed aggregate after 2020-06-01T00:00Z will contain only observation 1.
-
Observation 2 has an expected gap in data between 2020-02-01T00:00Z and 2020-02-07T00:00Z during which it should not be included in the aggregate. Using the process described above we can set the effective until to 2020-02-01T00:00Z. Then we may add observation 2 to the aggregate again with an effective from of 2020-02-07T00:00Z. In this configuration the computed aggregate from 2020-01-01T00:00Z to 2020-02-01T00:00Z will contain observations 1 and 2. From 2020-02-01T00:00Z to 2020-02-07T00:00Z the aggregate will contain observation 1. After 2020-02-07T00:00Z the aggregate will contain observations 1 and 2.
-
Observation 2 was added with an incorrect effective from or did not contain the expected data. To remove the observation 2 from the aggregate entirely, we can delete the observation from the aggregate. If observation 2 is included in the aggregate more than once, as described in situation 2 above, and we would like to preserve the existing effective ranges, we can set the effective until for observation 2 to just before the incorrect effective from. This will effectively nullify the single instance of effective from.
Delete an Observation from an Aggregate
Deleting an observation from an aggregate will remove all effective from and effective until values for the observation, and the observation will no longer be included in the computed aggregate.
-
Navigate to the Aggregate listing page using the Aggregates link in the left sidebar. Select the Aggregate to delete an observation from.
-
On the aggregate page, locate the observation to delete in the observations table. Click on the Delete link for the observation and confirm the deletion.
Create New Observation or Forecast
To create an Observation or Forecast, an associated site must already exist (see Create New Site).
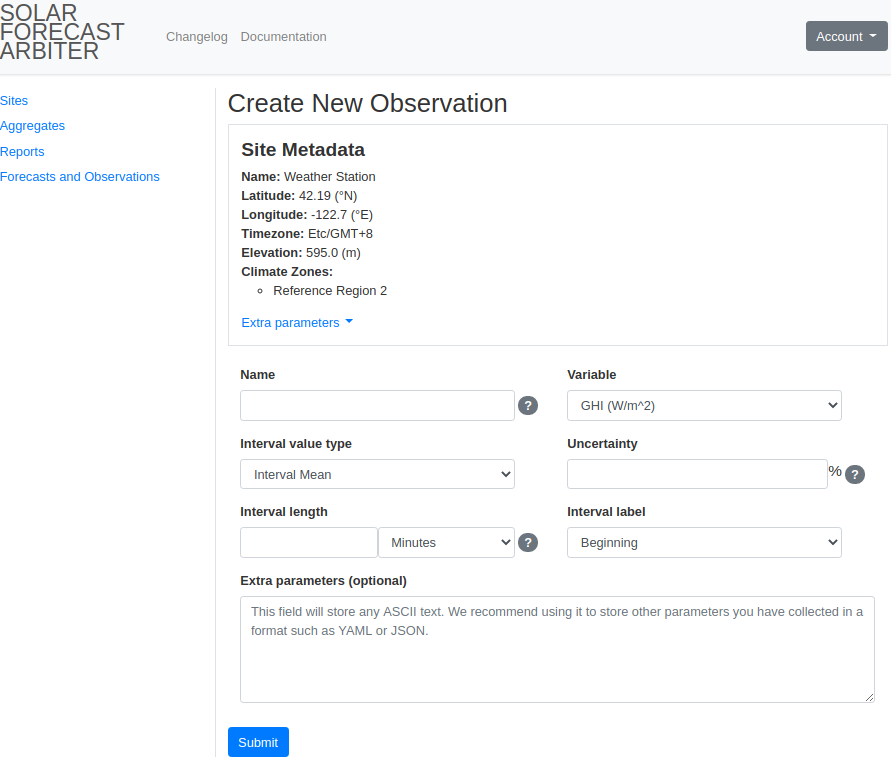
Create New Observation
-
Navigate to the Site listing page using the Sites link in the left sidebar. Select the site for which you are adding an Observation.
-
Click the Create new Observation button on the Site page.
-
Enter metadata for your Observation. On submission, you will be redirected to an Observation page which displays the new Observation metadata and a link to add Observation data (see Upload Data).
- Observation form
- Created Observation page
- Observation form
Create New Forecast
Forecasts can be created for either a Site or an Aggregate.
-
Navigate to the sites or aggregates page using the sidebar, then select the site or aggregate for which you are adding a Forecast.
-
On the site or aggregate page, click the Create new Forecast button.
-
Enter metadata for your Forecast. Please see the Definitions for a full description of how to specify Forecast metadata. On submission, you will be redirected to a Forecast page which displays the new Forecast metadata and a link to add Forecast data (see Upload Data).
- Forecast form
- Created Forecast page
- Forecast form
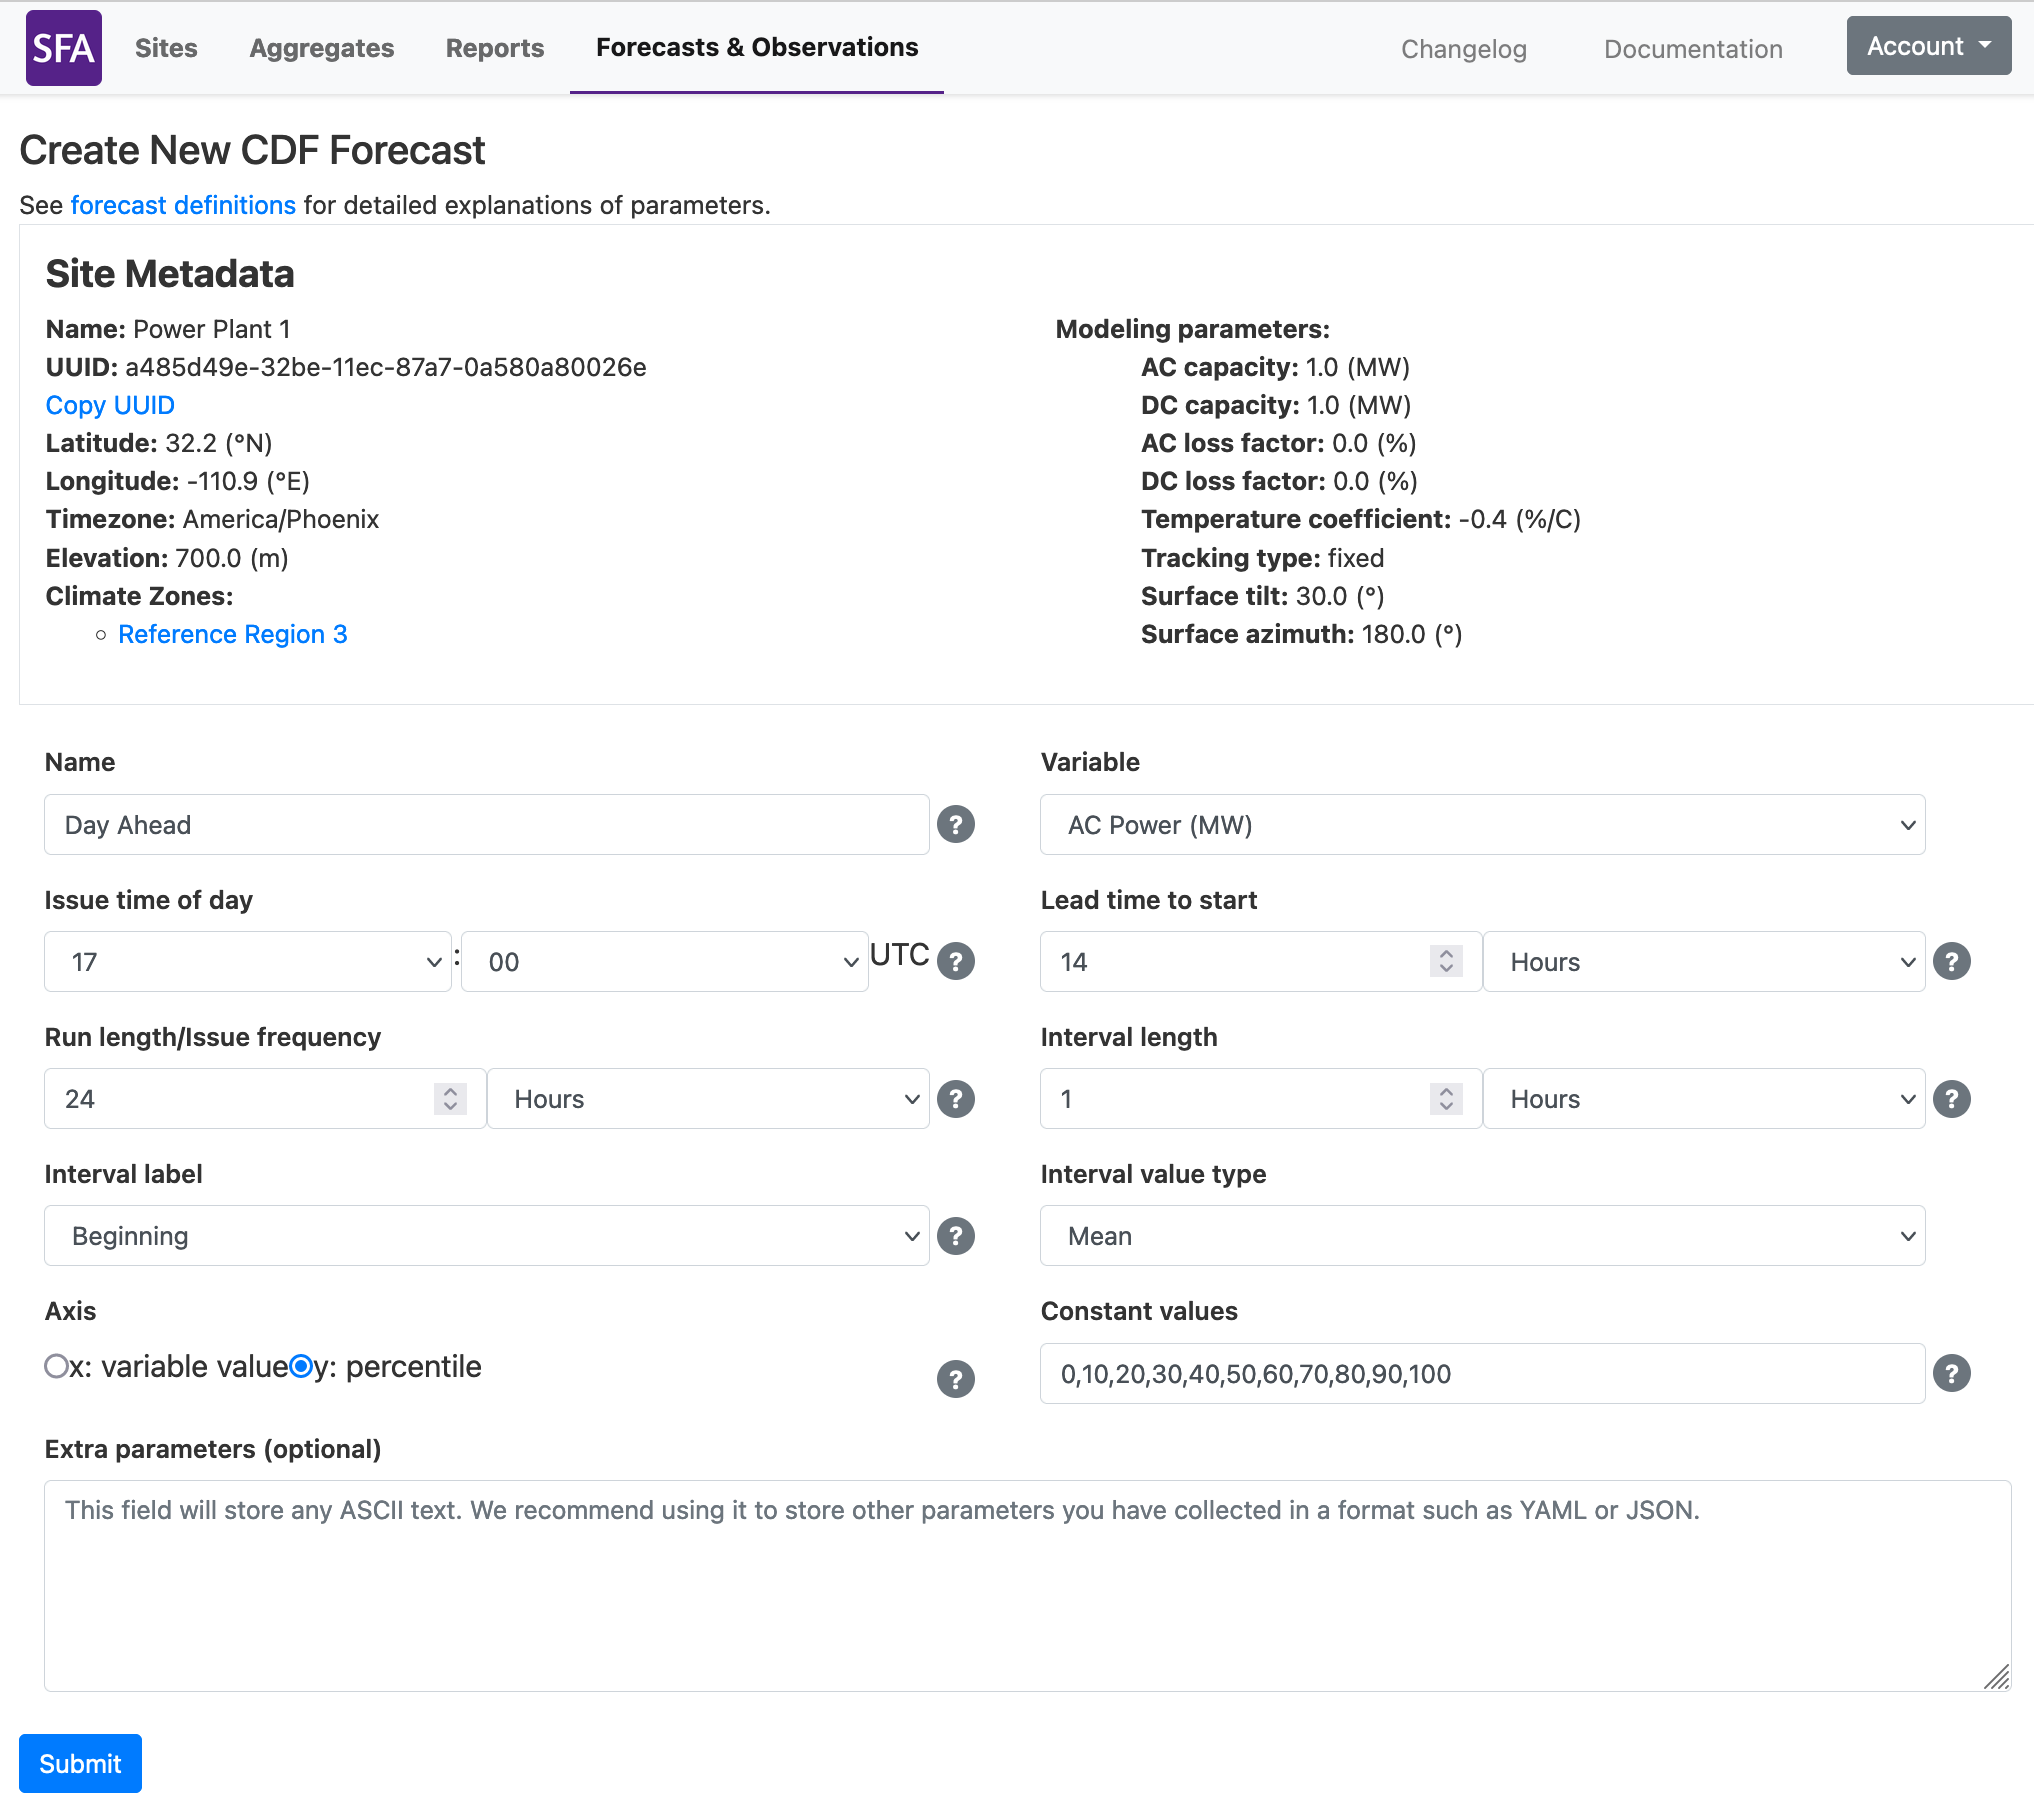
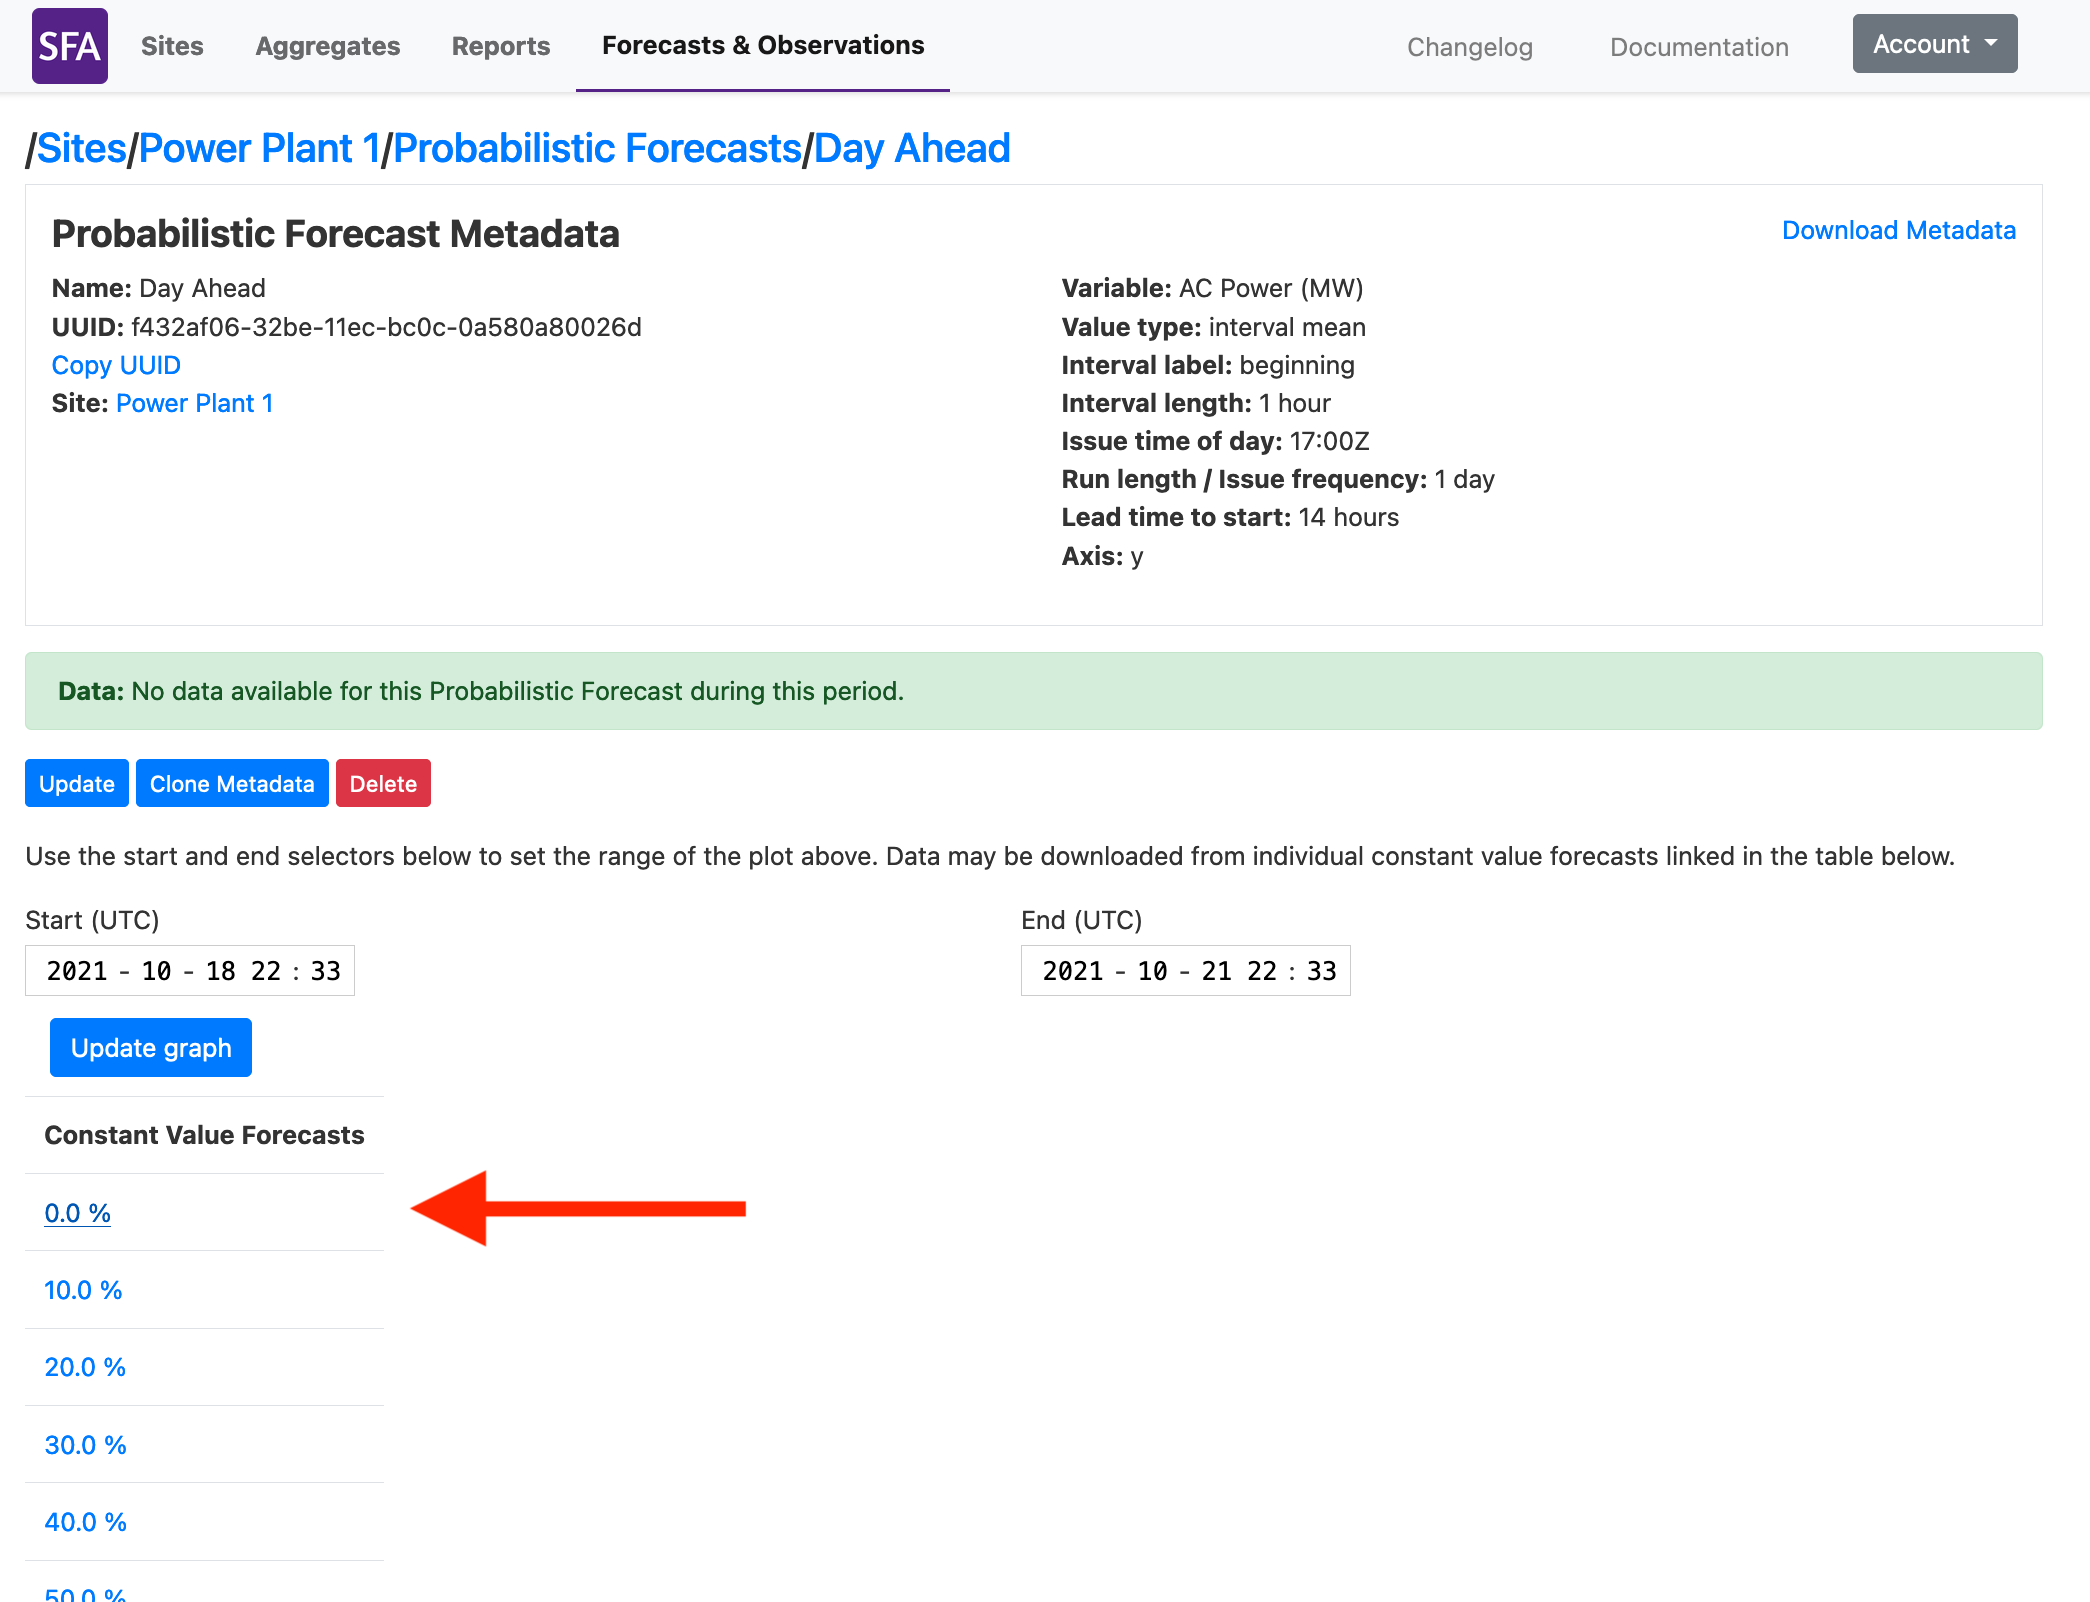
Create New Probabilistic Forecast
Probabilistic Forecasts can be created for either a Site or an Aggregate. The process is very similar to creating a point forecast, but requires the specification of “constant values” of percentiles or thresholds in addition to the standard forecast parameters. For example, a forecaster may create a probabilistic forecast specification with constant percentile values, and then the forecaster will submit forecasts of the irradiance, power, etc. for each percentile at each time.
-
Navigate to the sites or aggregates page using the sidebar, then select the site or aggregate for which you are adding a Forecast.
-
On the site or aggregate page, click the Create new Probabilistic Forecast button.
-
Enter metadata for your Probabilistic Forecast. Please see the Definitions for a full description of how to specify Probabilistic Forecast metadata. On submission, you will be redirected to a Probabilistic Forecast page which displays the new Probabilistic Forecast metadata. The page also contains links to each of the “constant value” percentiles or thresholds for which you can upload data (see Upload Probabilistic Forecast Data).
- Probabilistic Forecast form
- Probabilistic Forecast form
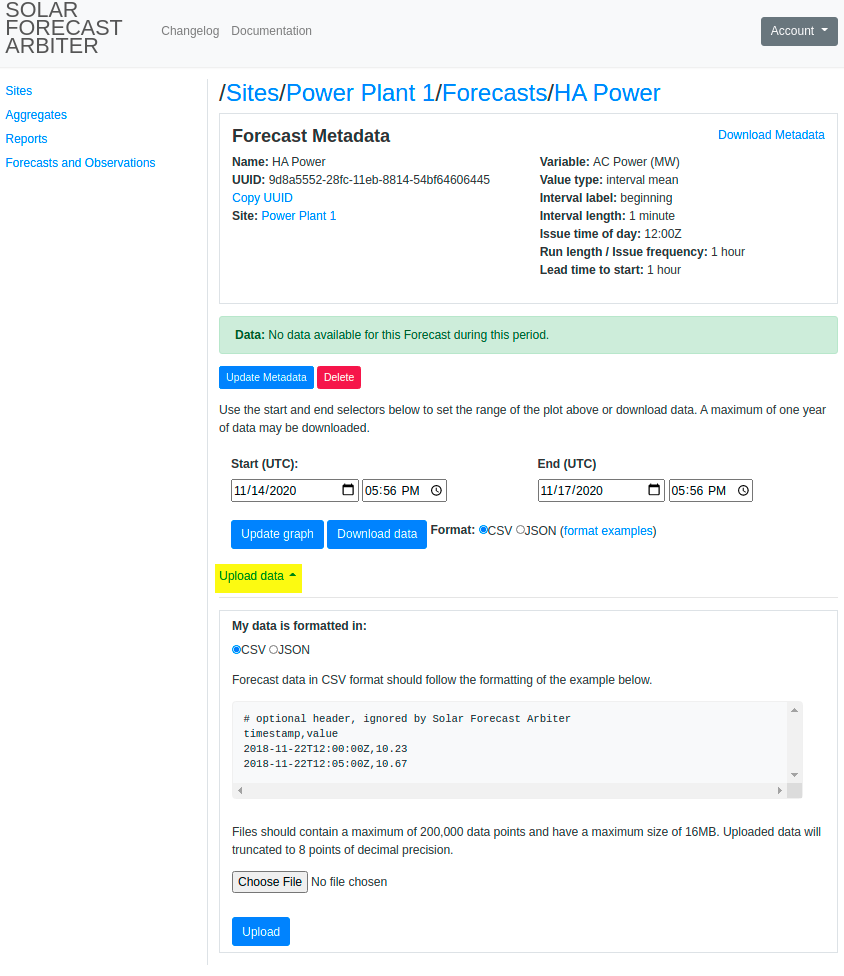
Upload data
To upload data, an associated Site and Observation or Forecast object must already exist (see Create New Site or Create New Observation or Forecast). The instructions here will describe the process of uploading data using the dashboard. Uploading data may be automated using the API, see https://api.solarforecastarbiter.org/ for detailed documentation.
Limits on Data Size
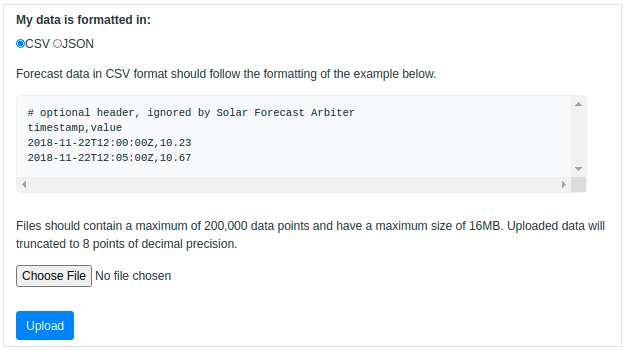
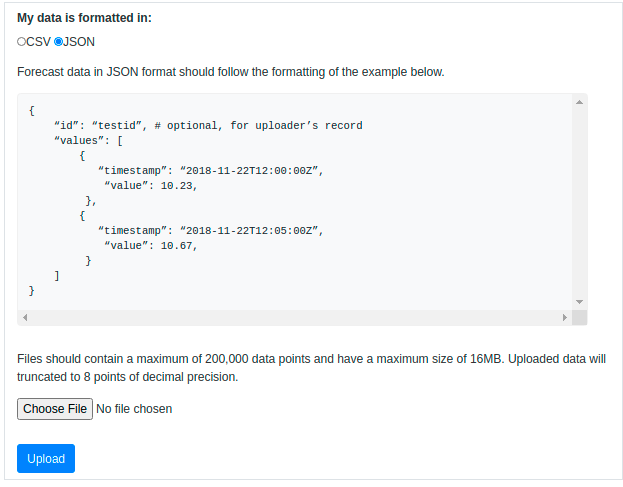
Data uploads are limited to 200,000 data points or 16 MB, whichever limit is hit first. File size limits are more commonly reached when using the JSON format. All values are rounded to 8 points of decimal precision when they are stored. Users may reduce file size by providing data with 8 or less points of precision. Because the Arbiter does not support data interval lengths of less than one minute, file size may also be reduced by utilizing a timestamp format with a one minute resolution.
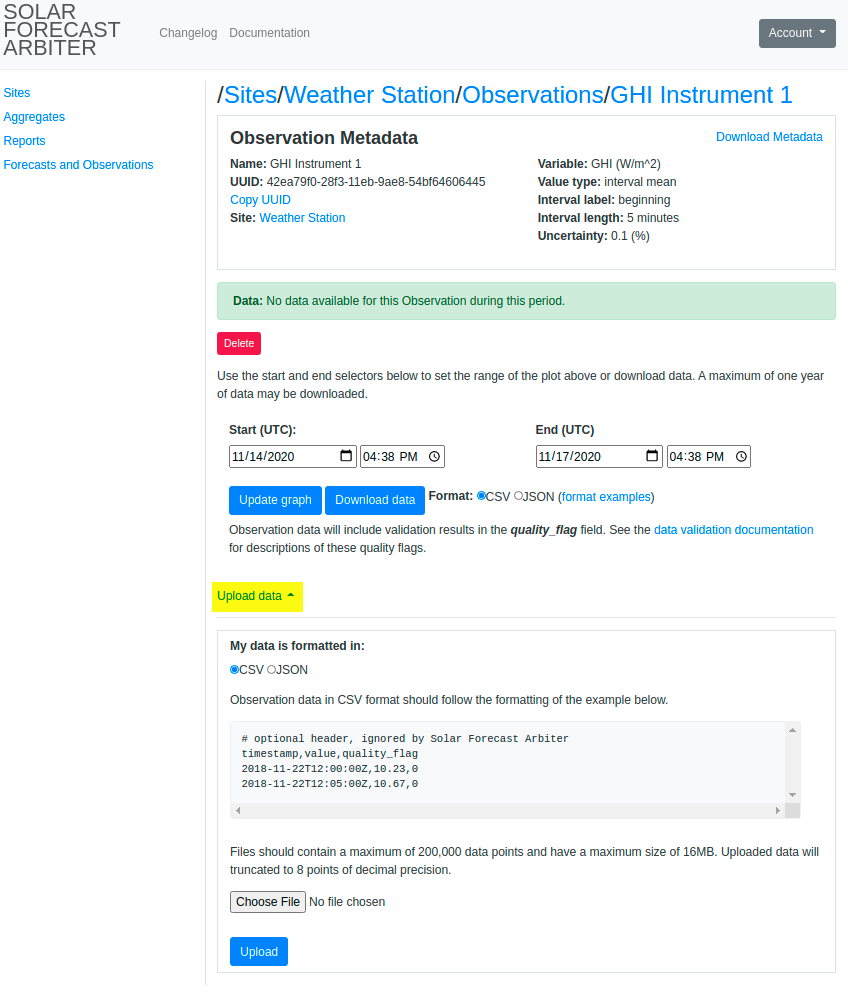
Upload Observation Data
-
From Sites listing page, click on a site.
-
Click Observations to find the Observations listing for that site.
-
Select an Observation. Click Upload Data at the bottom of the Observation page to expose the data upload form.
-
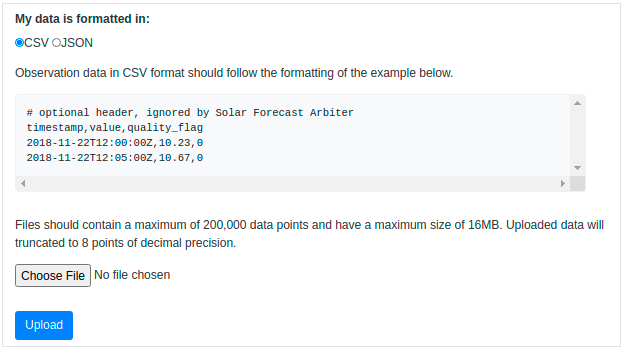
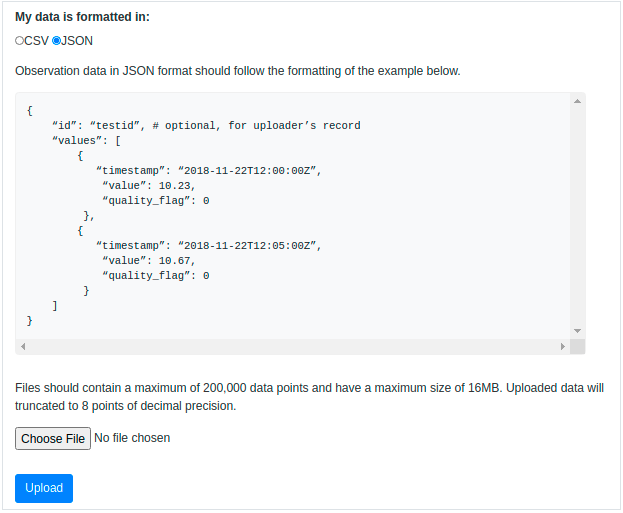
Select the file type to display an example of the expected file format. Click Choose File to select the data file and click Upload.
- CSV format
- JSON format
- CSV format
Upload Forecast Data
-
From Sites listing page, click on a site.
-
Click Forecast to find the Forecasts listing for that site.
-
Select a Forecast. Click Upload Data at the bottom of the Forecast page to expose the data upload form.
-
Select the file type to display an example of the expected file format. Click Choose File to select the data file and click Upload.
- CSV format
- JSON format
- CSV format
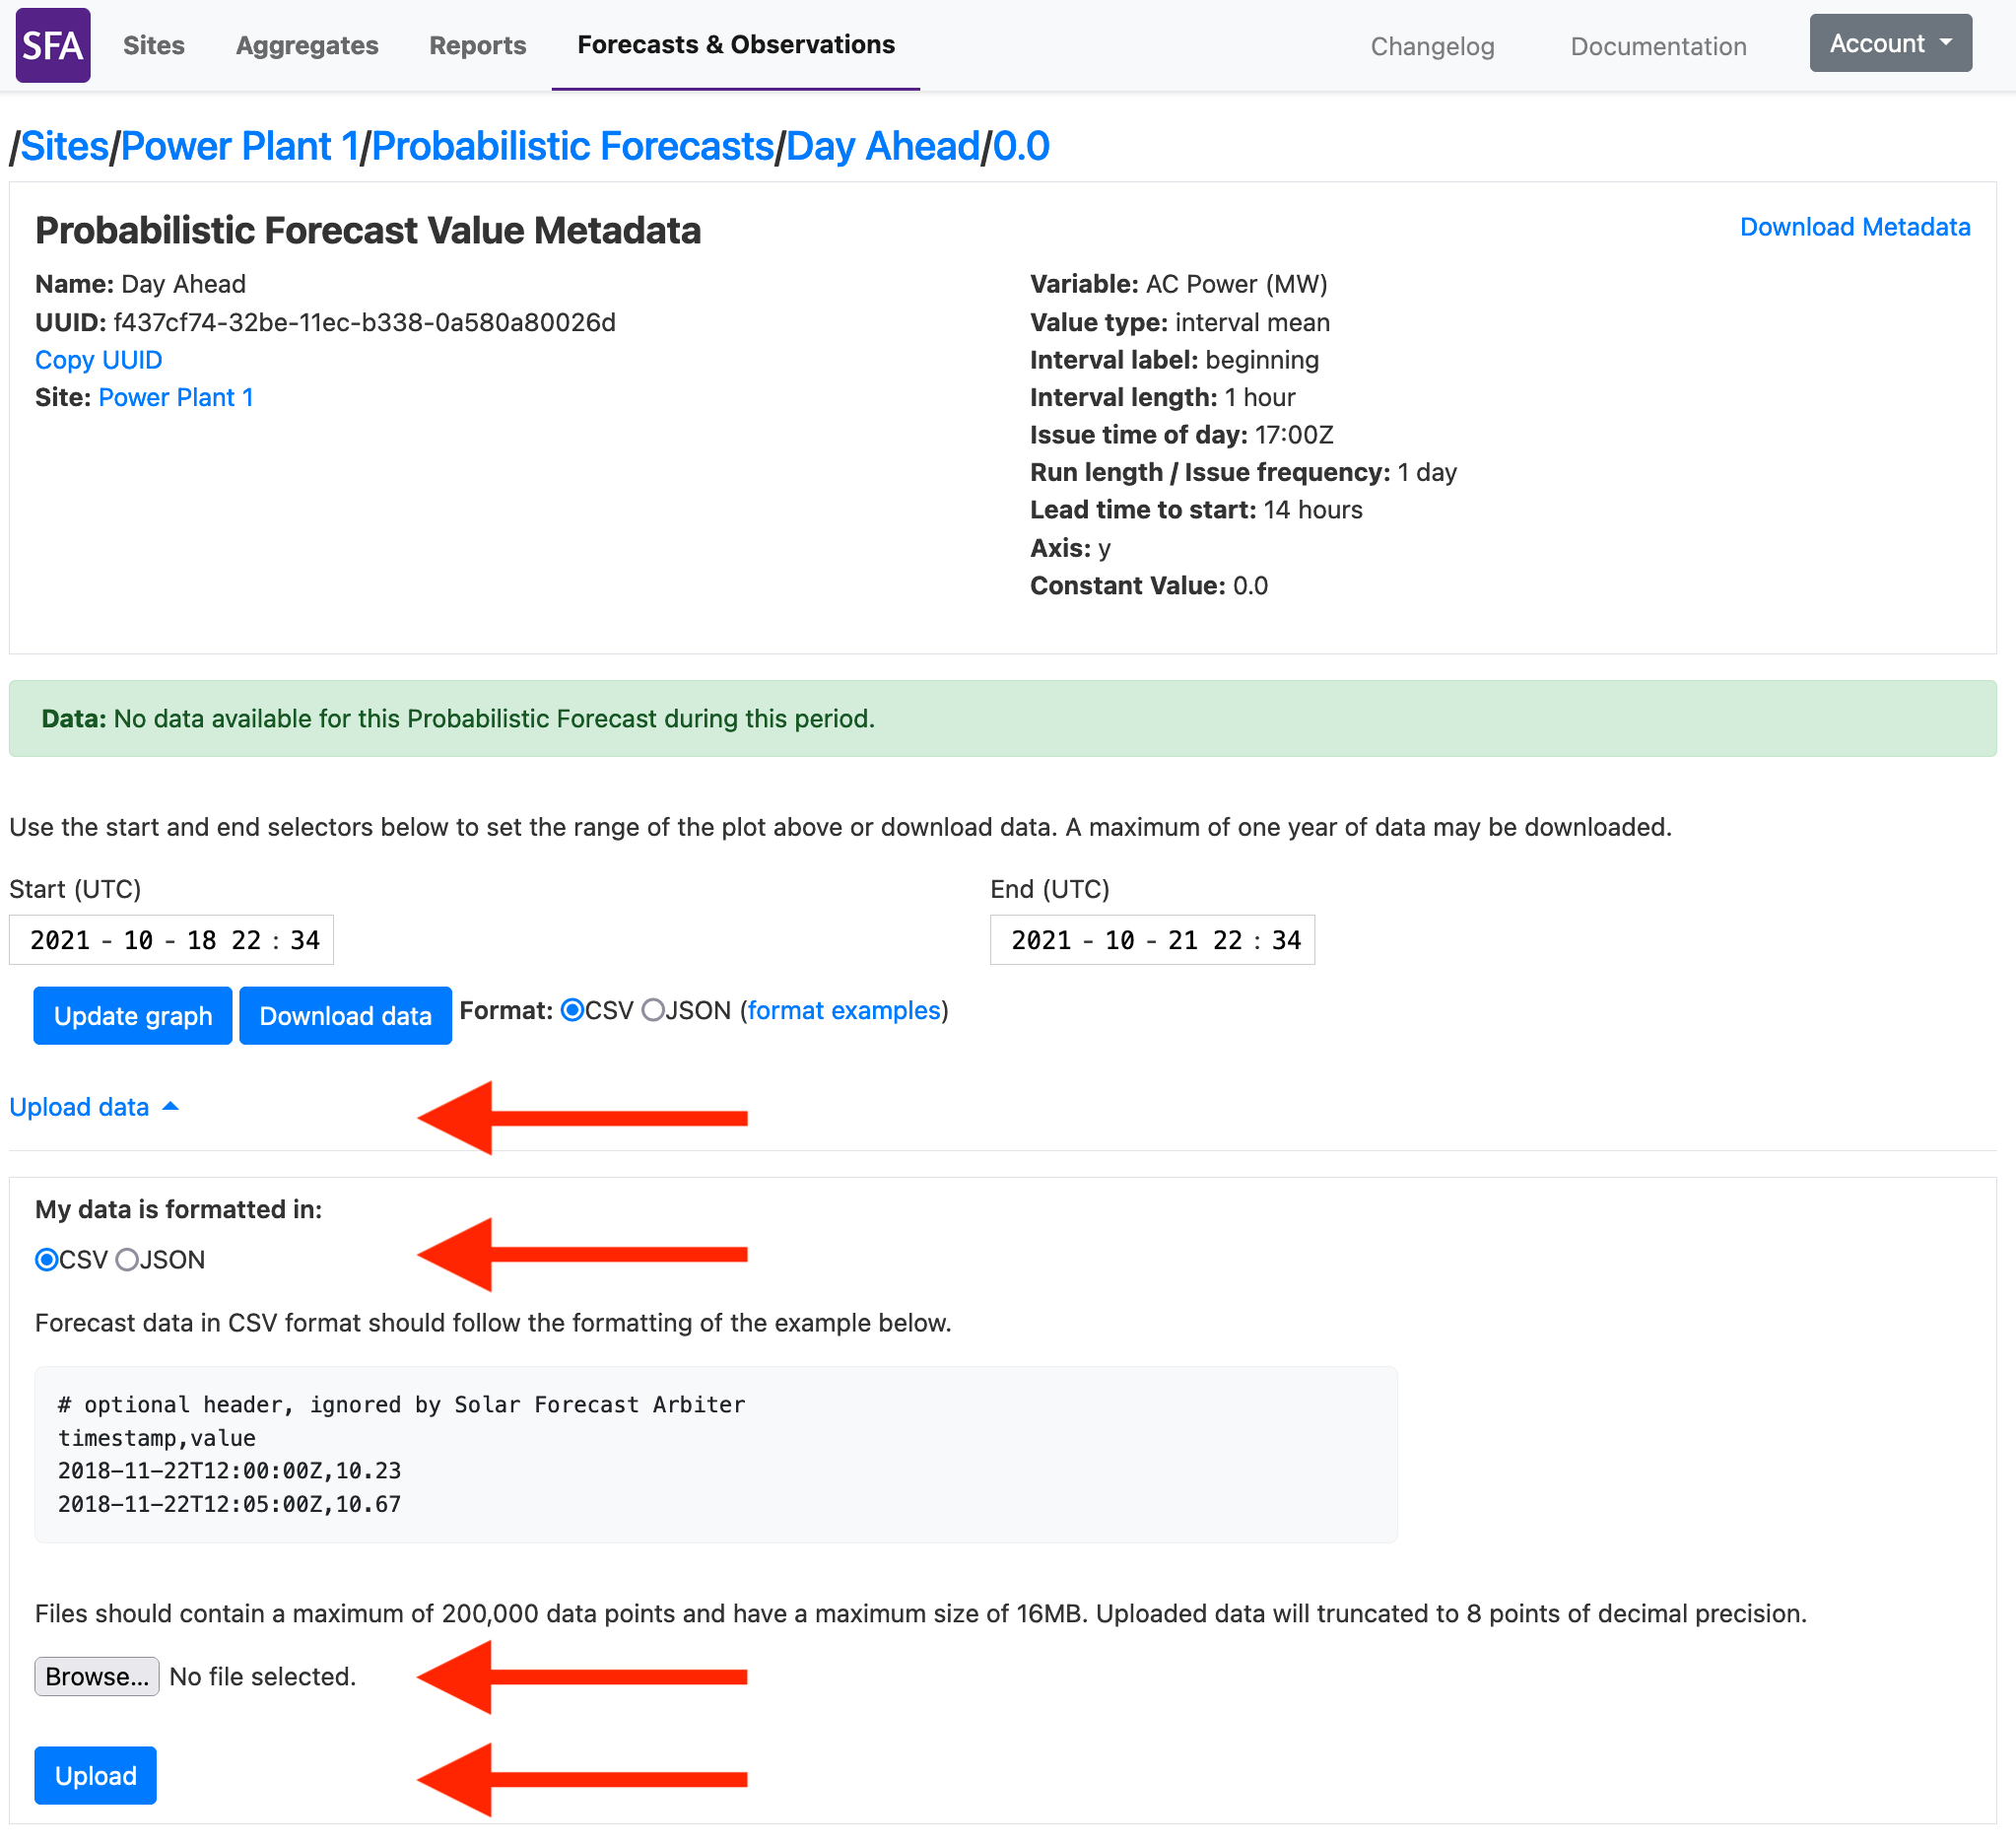
Upload Probabilistic Forecast Data
Uploading data for probabilistic forecasts follows a similar process as for point forecasts. The key difference is that a separate upload is required for each percentile or for each threshold that defines the probabilistic forecast. As a result, the file format is identical for all forecast uploads and there is no need to concern yourself with the complicated headers or keys that would be needed to describe all components of a probabilistic forecast within a single file. See the API documentation for the routes needed to automate the upload process.
-
From Sites listing page, click on a site.
-
Click Probabilistic Forecast to find the Probabilistic Forecasts listing for that site.
-
Select a Probabilistic Forecast. Click the “constant value” corresponding to the percentile or threshold that you would like to upload data for.
-
Click Upload Data at the bottom of the Forecast page to expose the data upload form. Select the file type to display an example of the expected file format. Click Choose File to select the data file and click Upload.
Download Data
The instructions here will describe the process of downloading data using the dashboard. Users may also utilize the API to download data. See the API documentation for details.
Limits on Download size
Data downloads are limited to a maximum of one year of data per request. Users may download more than one year of data by making multiple requests.
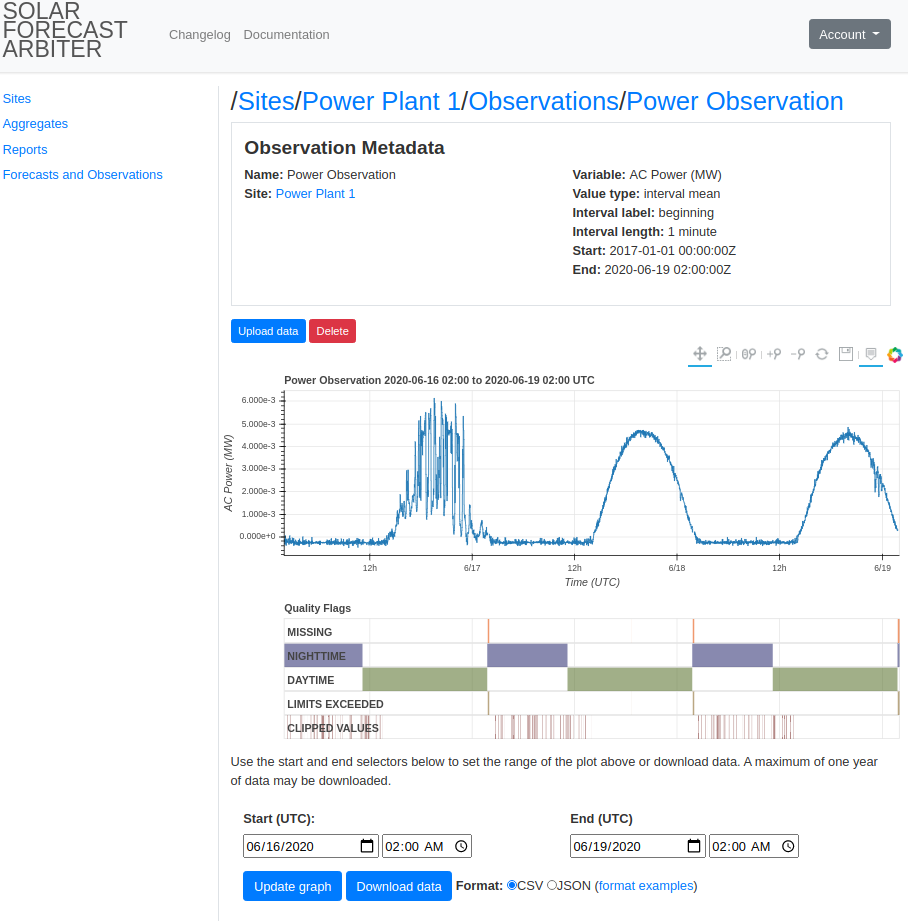
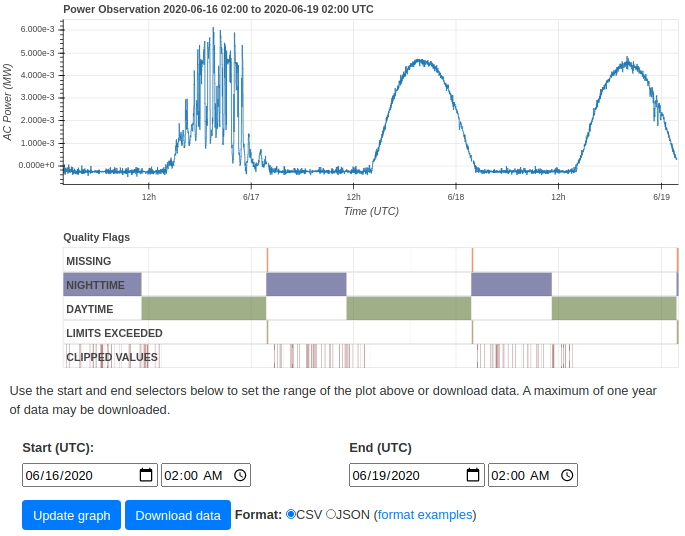
Download Observation data
-
From Sites listing page, click on a site.
-
Click Observations to find the Observations listing for that site.
-
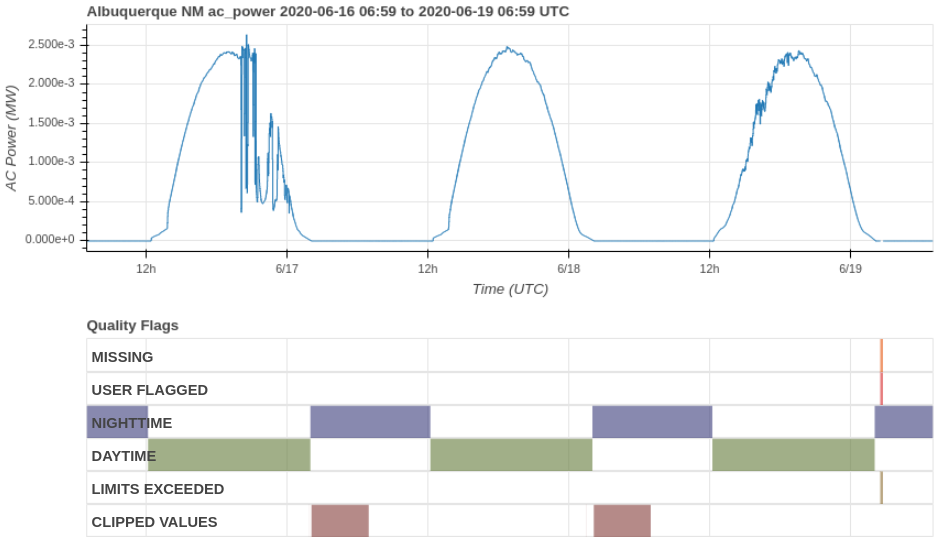
Specify a date range and data format, and click Download data. You may use the Set time range button to view a plot of the data before downloading.
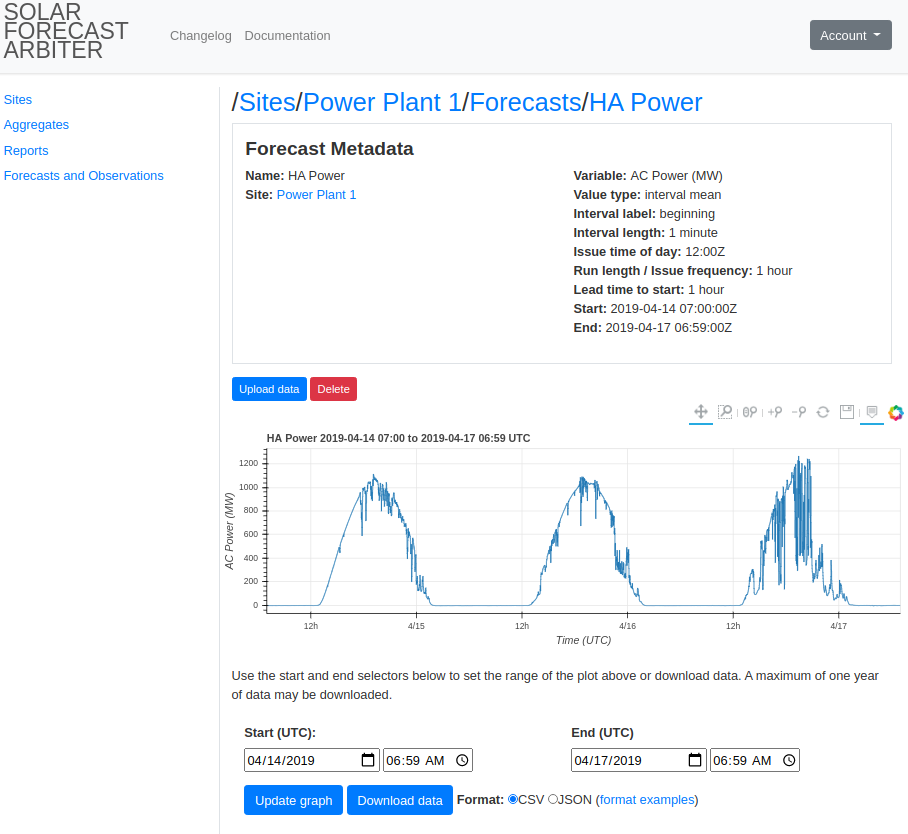
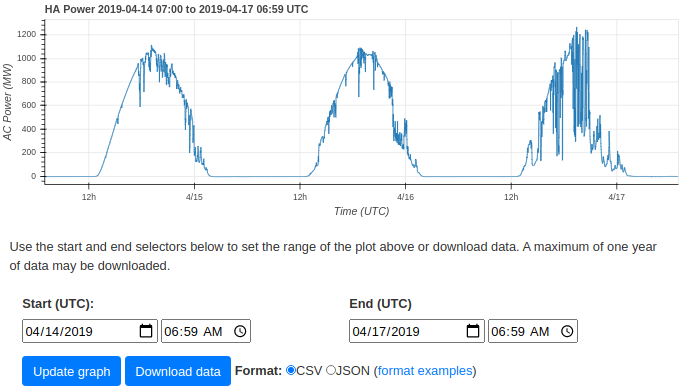
Download Forecast data
-
From Sites listing page, click on a site.
-
Click Forecasts to find the Observations listing for that site.
-
Specify a date range and data format, and click Download data. You may use the Set time range button to view a plot of the data before downloading.
Delete Data
Metadata may be deleted from the Solar Forecast Arbiter with proper permissions. If the metadata for a forecast, observation, or probabilistic forecast is deleted, all values for that object are also deleted automatically. Individual forecast or observation values cannot currently be deleted from the Solar Forecast Arbiter. However, one may upload NaN data (null in JSON, ‘NaN’ or an empty field in CSV) at the appropriate timestamps as a workaround. Site objects may only be deleted after all observations at said site are also deleted. In the case of a site that has been shared with users in other organizations, contact the users to delete those observations referencing the site or contact the Solar Forecast Arbiter administrators at admin@solarforecastarbiter.org.
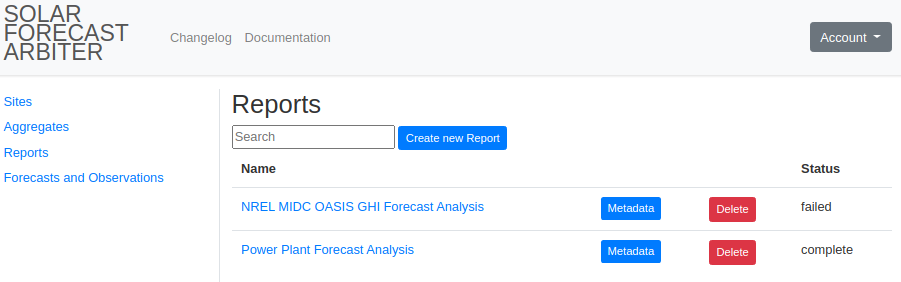
Create New Report
-
Use the Reports link on the left sidebar to view the reports listing page. Click the Create new Report link.
-
Select the type of report from the Report Type menu at the top of the page. The report type dictates the type of forecast that will be analyzed in the report. Each forecast type (deterministic, event, and probabilistic) will have different available metrics. Event forecasts do not support reference forecasts or uncertainty.
-
Enter the report name and a start and end for the period to analyze. Create pairs of Observations and Forecasts by following these steps:
- Select whether to compare the forecast to an Aggregate or Observation using the ‘Compare Forecast to’ field.
- If comparing the Forecast to an Observation, select a Site. The forecast field will populate with a list of forecasts located at the site. Use the search bar to filter the list by name.
- Select a Forecast. Use the Variable menu to limit the displayed forecasts to specific variable. The Observation (or Aggregate) and Reference Forecast fields will be populated with options that match the forecast’s site or aggregate and variable.
- Select an Observation or Aggregate.
- (Optional) Select a Reference Forecast. Specifying a reference forecast is only required when calculating the forecast skill metric, and are not applicable for event forecasts.
- Choose how to define uncertainty. You may choose to ignore uncertainty, use the uncertainty value defined in the observation metadata, or provide your own value. The default option is to ignore uncertainty. Uncertainty cannot be defined for event forecasts.
- Click the Add Forecast, Observation pair.
Multiple Pairs can be added by repeating this process. Pairs can be removed by clicking the red ‘remove’ link on the right side of the forecast & observation box.
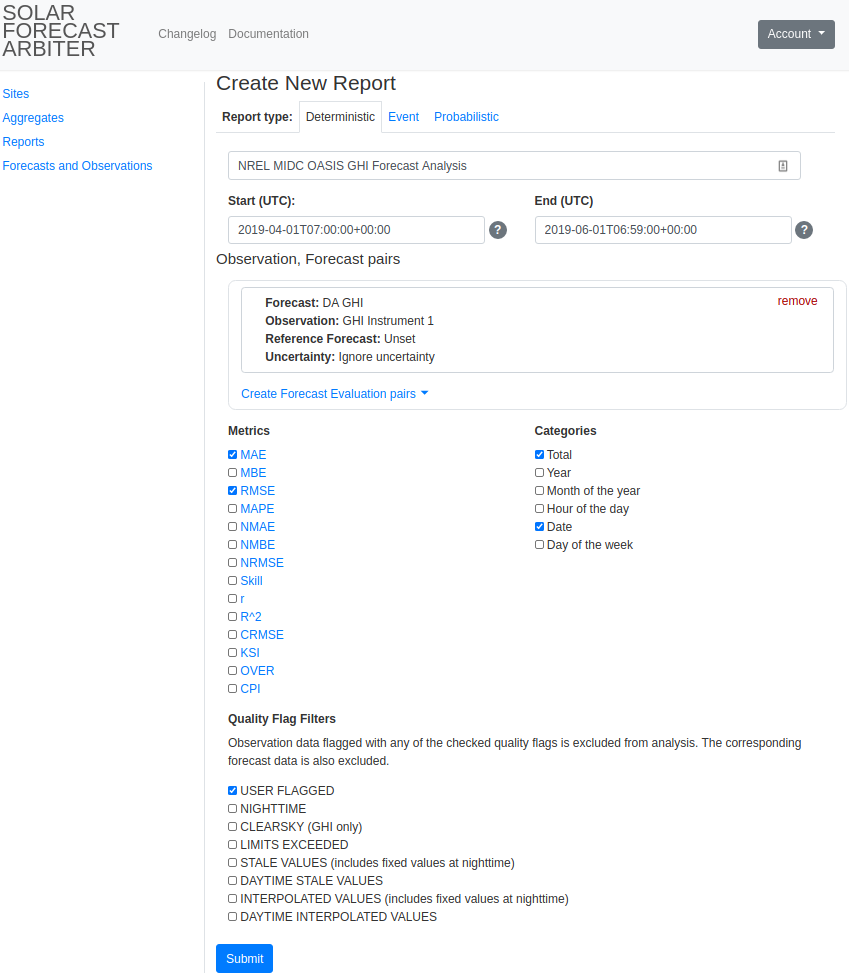
After clicking submit, you will be returned to the report listing page where you will see the newly created report with a status of pending. The Arbiter will process the report and then set its status to complete or failed. You may then view the web version of the report. Failed reports will contain an error message about the failure.
Quality Flag Filters
Users may define quality flag filters to exclude observation data from reports. These filters allow users to entirely remove erroneous data and to conditionally remove data if an insufficient quantity of good data exists in a time period. Quality flag filters are defined by three fields:
-
Quality Flags: A list of quality flags (see data validation) to exclude.
-
Discard Before Resample: True or False. Indicates if observation values marked with these flags should be removed before resampling is performed. Use True for filters designed to exclude erroneous observation data that should never be considered. Use False for filters designed to exclude intervals that contain valid but undesirable data, such as the hours of sunrise/sunset or hours that are mostly clear.
-
Resample Threshold Percentage: The percentage of datapoints in a resampled interval that must be flagged to exclude the entire interval.
Examples
The following examples will use the CSV data below to demonstrate the use of quality flag filters. Note that quality flags are converted to readable names here, but are retrieved from the dashboard and API as the bitmasks documented in the data validation section.
timestamp,value,quality_flags
timestamp,value,quality_flags
2020-01-01 11:00:00+00:00,0.0,"NIGHTIME"
2020-01-01 11:15:00+00:00,0.0,"NIGHTIME"
2020-01-01 11:30:00+00:00,0.0,"NIGHTIME"
2020-01-01 11:45:00+00:00,0.0,"NIGHTIME"
2020-01-01 12:00:00+00:00,100,"NIGHTIME,LIMITS EXCEEDED"
2020-01-01 12:15:00+00:00,110,"NIGHTIME,LIMITS EXCEEDED"
2020-01-01 12:30:00+00:00,600,"USER FLAGGED"
2020-01-01 12:45:00+00:00,130,""
2020-01-01 13:00:00+00:00,140,""
2020-01-01 13:15:00+00:00,150,""
2020-01-01 13:30:00+00:00,160,""
2020-01-01 13:45:00+00:00,170,""
Discarding intervals with incomplete data
We can use quality flags to exclude intervals that contain too much undesirable data. For example, if we are resampling to one hour intervals and don’t want to include hours where half or more of the data occurs at night time, we can use a filter like:
Quality Flags: "NIGHTTIME"
Discard Before Resample: False
Resample Threshold Percentage: 50%
the observation data above is filtered and resampled into:
timestamp,value
2020-01-01 13:00:00+00:00,155.0
The first and second hour interval is dropped because 100% and 50% of the datapoints
in those intervals are flagged with NIGHTTIME, meeting or exceeding the
resample threshold.
If we want to include intervals where half of the data are
flagged with NIGHTTIME, we could adjust the resample threshold
percentage to 51%. The threshold must be met or exceeded for an interval
to be excluded.
Using the filter:
Quality Flags: "NIGHTTIME"
Discard Before Resample: False
Resample Threshold Percentage: 51%
the observation data above is filtered and resampled into:
timestamp,value
2020-01-01 12:00:00+00:00,235.0
2020-01-01 13:00:00+00:00,155.0
Discarding erroneous data
If we want to remove erroneous data and exclude it from the resampling process, we can set discard before resample to True.
Using the filter:
Quality Flags: "USER FLAGGED"
Discard Before Resample: True
Resample Threshold Percentage: 50%
the observation data above is filtered and resampled into:
timestamp,value
2020-01-01 11:00:00+00:00,0.0
2020-01-01 12:00:00+00:00,113.33
2020-01-01 13:00:00+00:00,155.0
The datapoint flagged with USER FLAGGED was dropped before
resampling occurred, which reduces the 12:00 interval average from 235.0 to 113.33. The resampled interval is included in the resampled data because only
one point is flagged with USER FLAGGED, which does not exceed our 50% resample
threshold.
Filtering for multiple flags in a single filter
When listing multiple flags in a single filter, the number of unique datapoints flagged with any of the listed quality flags determines if the resample threshold percentage is exceeded or not.
Using the filter:
Quality Flags: "NIGHTTIME, USER FLAGGED"
Discard Before Resample: False
Resample Threshold Percentage: 75%
the observation data above is filtered and resampled into:
timestamp,value
2020-01-01 13:00:00+00:00,155.0
The first hour interval is dropped because 100% of timestamps in
the first hour are flagged NIGHTTIME. The second hour interval
is excluded because 75% of the points are flagged with either
NIGHTTIME, or USER FLAGGED, which meets the resample threshold.
Mixing filter types
Consider a situation where we want to exclude resampled intervals where 100% of the interval occurs during nighttime. Further, we’d like to exclude points that are flagged by the user or the limits are exceeded, and the corresponding resampled intervals should be excluded only if no valid data remains.
Using the quality flag filters:
Quality Flags: "USER FLAGGED,LIMITS EXCEEDED"
Discard Before Resample: True
Resample Threshold Percentage: 100%

Quality Flags: "NIGHTTIME"
Discard Before Resample: False
Resample Threshold Percentage: 100%
The 1 hour resampled data would be:
2020-01-01 12:00:00+00:00,130
2020-01-01 13:00:00+00:00,155
The first hour interval is excluded because all four points are
flagged with NIGHTTIME, which meets the 100% resample threshold.
In the the second hour interval the points at 12:00, 12:15, and 12:30
are USER FLAGGED or LIMITS EXCEEDED, so they are excluded before
resampling the interval, resulting in an average of 130. The resampled
interval is retained because only 75% of points are flagged.
The third hour contains no flagged points, so it’s also included after resampling.
Data Validation
The Solar Forecast Arbiter performs validation on all Observation data. It does not validate any forecast data. The data validation toolkit applies quality flags to values in observation data. The Solar Forecast Arbiter includes these quality flags with downloaded observation data in the form of a bit mask. Users can implement their own bit mask parsing functions or use the the parsing functions available in solarforecastarbiter-core. The table below shows quality flags and their bitmask.
| Quality Flag | Bitmask | Integer Value | Description |
|---|---|---|---|
| OK | 0000000000000000 |
0 | No validation flags. |
| USER FLAGGED | 0000000000000001 |
1 | User flagged data as problematic before uploading to Arbiter. |
| NIGHTTIME | 0000000000010000 |
16 | Value occurs at night. |
| CLEARSKY | 0000000000100000 |
32 | Values consistent with clear sky condition. |
| SHADED | 0000000001000000 |
64 | Values indicate module shading. Not implemented. |
| UNEVEN FREQUENCY | 0000000010000000 |
128 | Difference in timestamp between value and previous value does not conform to observation frequency. |
| LIMITS EXCEEDED | 0000000100000000 |
256 | Physical limits exceeded. Uses QCrad criteria for irradiance, DC or AC capacity for power. |
| CLEARSKY EXCEEDED | 0000001000000000 |
512 | Value greater than clearsky value. |
| STALE VALUES | 0000010000000000 |
1024 | Values are unchanged for several intervals, suggesting an issue with communications. |
| INTERPOLATED VALUES | 0000100000000000 |
2048 | Values appear linear, suggesting interpolation. |
| CLIPPED VALUES | 0001000000000000 |
4096 | Values indicate possible clipped power levels. |
| INCONSISTENT IRRADIANCE COMPONENTS | 0010000000000000 |
8192 | GHI, DHI, and DNI are inconsistent. |
| DAILY VALIDATION APPLIED | 0100000000000000 |
16384 | The Arbiter has analyzed this point in the context of all of the points around it. |
The dashboard displays derived quality flags that are not provided in downloaded data. Derived quality flags appear on timeseries plots and are available for filtering when creating a report. Derived quality flags are described in the table below.
| Quality Flag | Description |
|---|---|
| DAYTIME | Value occurs during daytime. |
| DAYTIME STALE VALUES | Stale values that occur during daytime. |
| DAYTIME INTERPOLATED VALUES | Interpolated values that occur during daytime |
Quality Flags on the Dashboard
On the Dashboard quality flags are plotted along with their timeseries values. Each type of quality flag has it’s own colored bar running parallel to the x axis of the timeseries plots. A vertical colored bar indicates that the data was flagged at that timestamp while a solid colored blocks indicate the data was flagged within the colored range.